library(ggseg)Loading required package: ggseg.formatslibrary(ggplot2)
ggplot() +
geom_brain(atlas = dk, mapping = aes(fill = region), show.legend = FALSE) +
theme_void()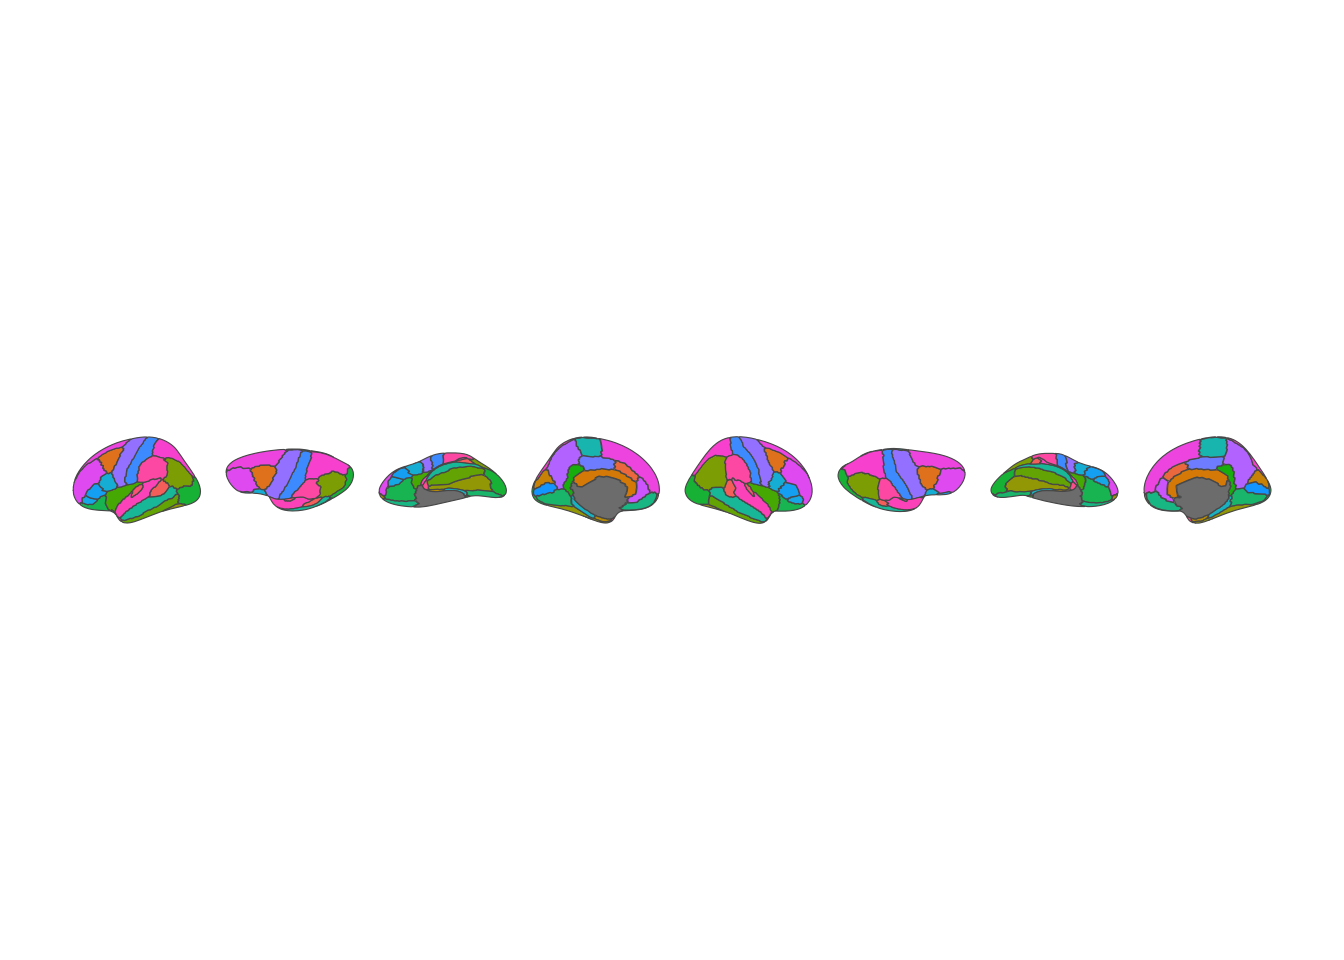
Welcome to the new ggseg website. This site provides documentation, resources, and news about the ggseg suite of R packages for brain atlas visualization.
Neuroimaging research frequently involves mapping statistical results onto brain regions defined by anatomical or functional atlases. Whether you’re showing which brain areas respond to a task, where structural differences exist between groups, or how connectivity patterns vary across individuals, visualizing these results on a brain surface helps communicate findings clearly.
The ggseg suite brings brain atlas visualization into the tidyverse ecosystem, making it easy to create publication-ready figures with the familiar grammar of graphics.
The ggseg ecosystem consists of three layers:
Core packages provide the visualization engine:
Atlas packages distribute brain atlas data as installable R packages. Each atlas package contains polygon data for 2D plots and/or mesh data for 3D visualization.
Atlases are the individual brain parcellations within each package. A single package might contain multiple related atlases (e.g., different resolutions or variants).
The core ggseg package provides geom_brain() for plotting brain data with ggplot2:
library(ggseg)Loading required package: ggseg.formatslibrary(ggplot2)
ggplot() +
geom_brain(atlas = dk, mapping = aes(fill = region), show.legend = FALSE) +
theme_void()
Map your own data by joining it to the atlas:
library(dplyr)
Attaching package: 'dplyr'The following objects are masked from 'package:stats':
filter, lagThe following objects are masked from 'package:base':
intersect, setdiff, setequal, unionsomeData <- tibble(
region = c(
"superior frontal",
"precentral",
"lateral orbitofrontal",
"parsopercularis",
"paracentral",
"pericalcarine"
),
p = sample(seq(0, 0.05, by = 0.001), 6)
)
someData |>
ggplot() +
geom_brain(
atlas = dk,
position = position_brain(hemi ~ view),
aes(fill = p)
) +
scale_fill_viridis_c(option = "inferno", direction = -1) +
theme_void() +
labs(fill = "p-value")merging atlas and data by 'region'Warning: Some data not merged properly. Check for naming errors in data:
label view hemi region lobe geometry atlas type colour
<chr> <chr> <chr> <chr> <chr> <GEOMETRYCOLLECTION> <chr> <chr> <chr>
1 <NA> <NA> <NA> parsoper… <NA> GEOMETRYCOLLECTION EMPTY <NA> <NA> <NA>
# ℹ 1 more variable: p <dbl>Warning: Some data not merged. Check for spelling mistakes in: region p 185
parsopercularis 0.007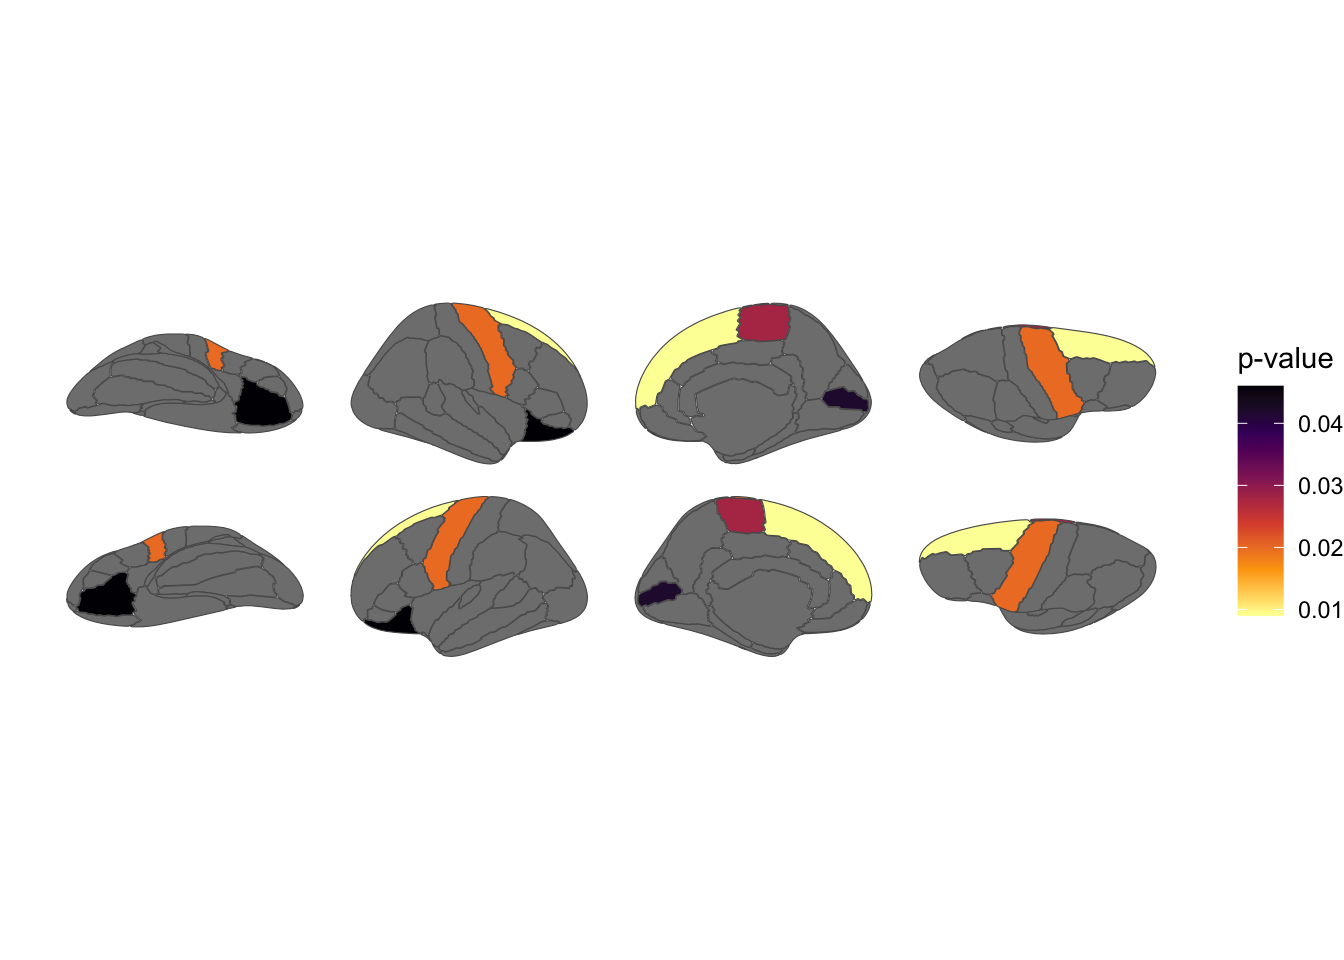
For interactive 3D plots, ggseg3d uses plotly:
library(ggseg3d)

ggseg3d(atlas = dk) |>
  pan_camera("right lateral")
Interactive 3D brain visualization
The ggseg ecosystem includes atlases covering:
Browse all available atlases on the Ecosystem page.
Install the core packages from R-universe:
install.packages(
  c("ggseg", "ggseg3d", "ggsegExtra"),
  repos = c(
    "https://ggseg.r-universe.dev",
    "https://cloud.r-project.org"
  )
)
Then install any atlas packages you need:
install.packages(
  "ggsegYeo2011",
  repos = c(
    "https://ggseg.r-universe.dev",
    "https://cloud.r-project.org"
  )
)
Check out the documentation for tutorials and vignettes.