Playground
Explore brain atlas visualizations
Pick an atlas, view, and palette to see the result.
Atlas
View
Palette

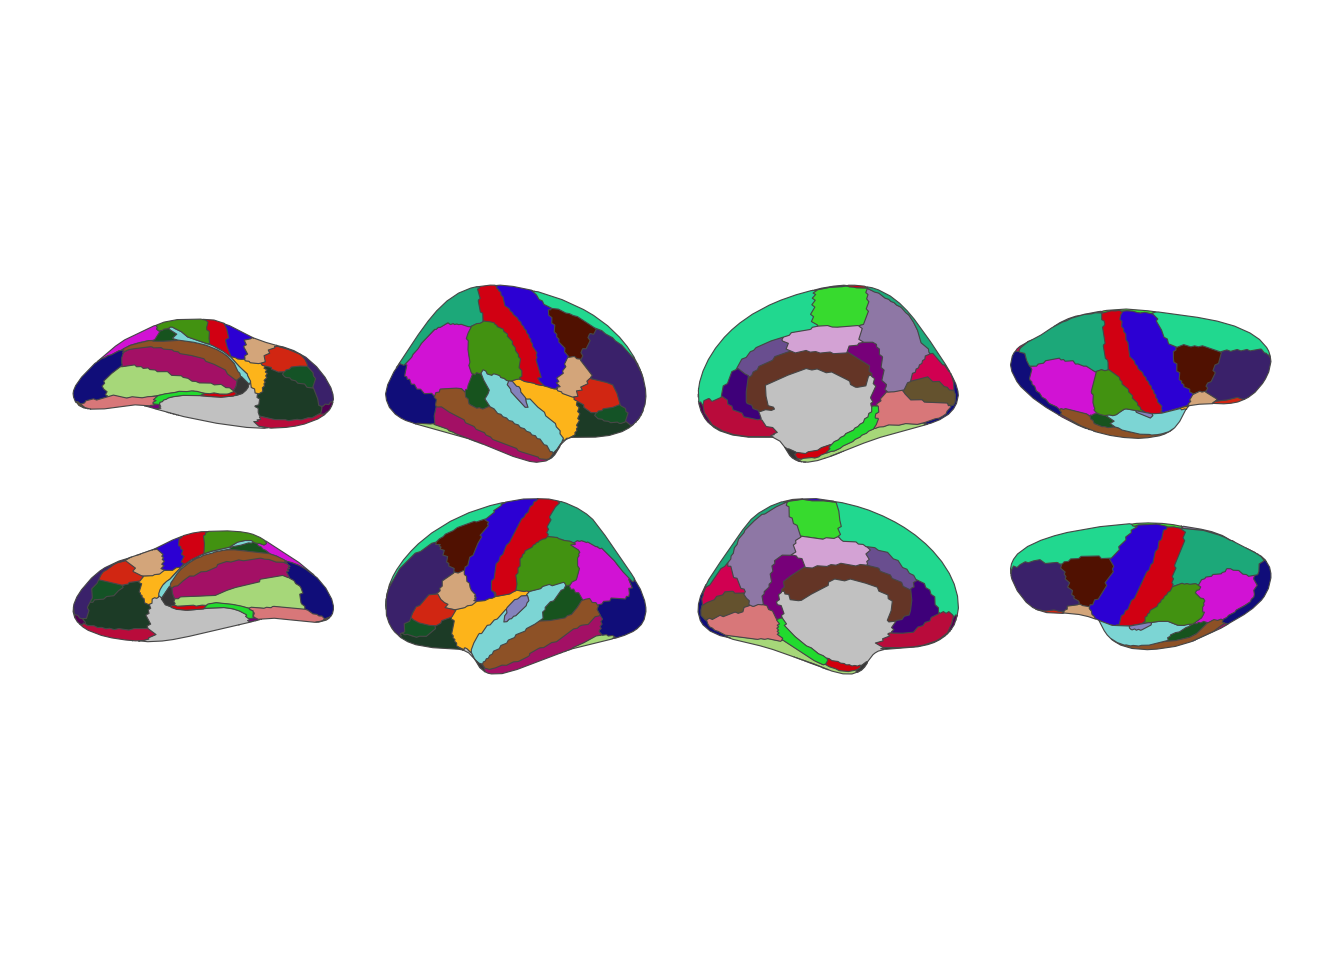
library(ggseg)
library(ggseg.formats)
ggplot() +
geom_brain(
atlas = dk(),
aes(fill = label),
position = position_brain(hemi ~ view),
show.legend = FALSE
) +
scale_fill_manual(
values = atlas_palette(dk()),
na.value = "grey80"
) +
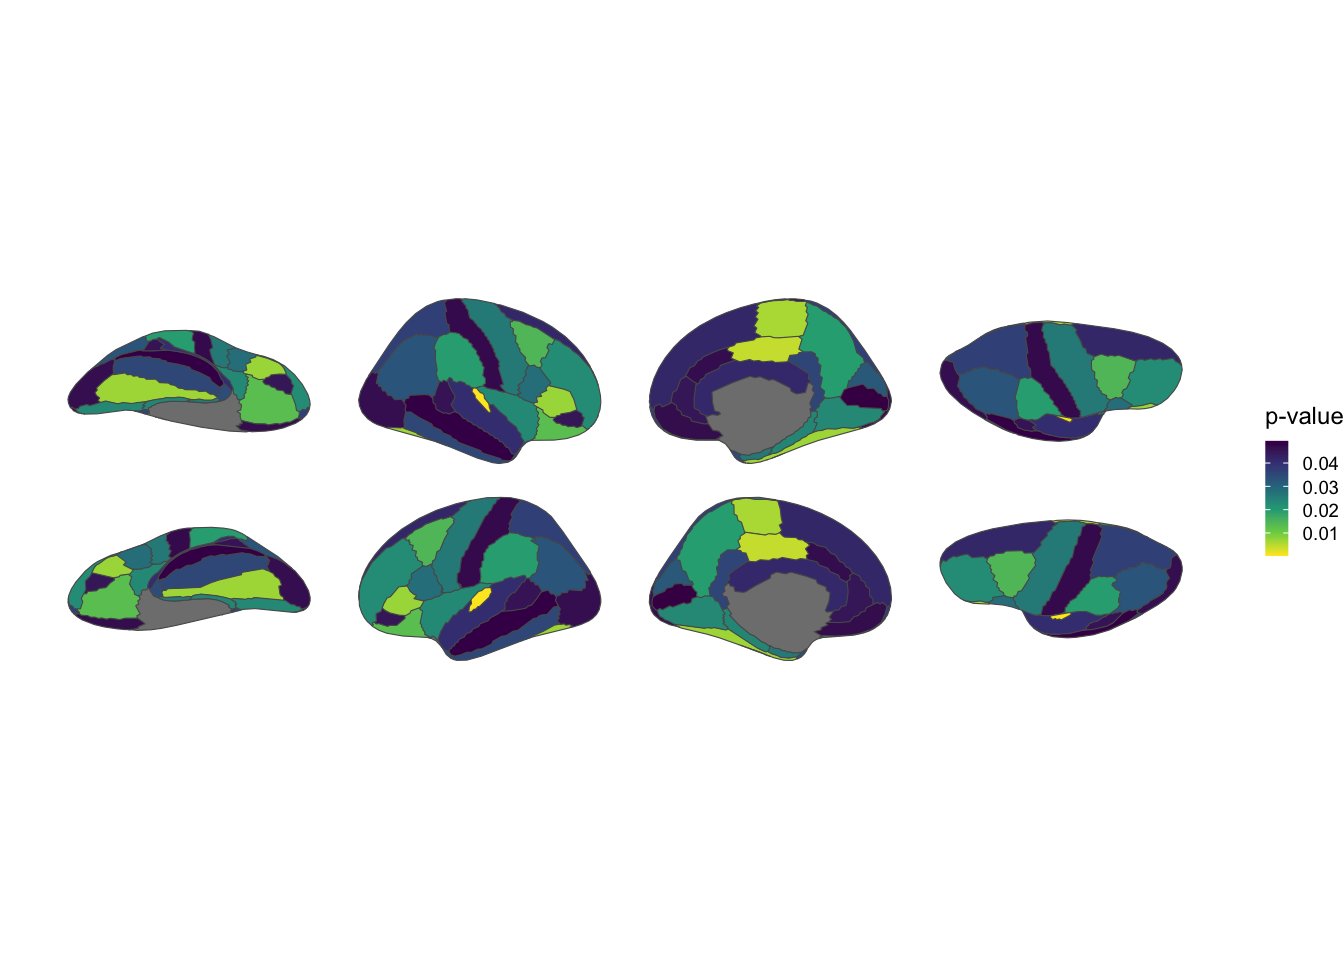
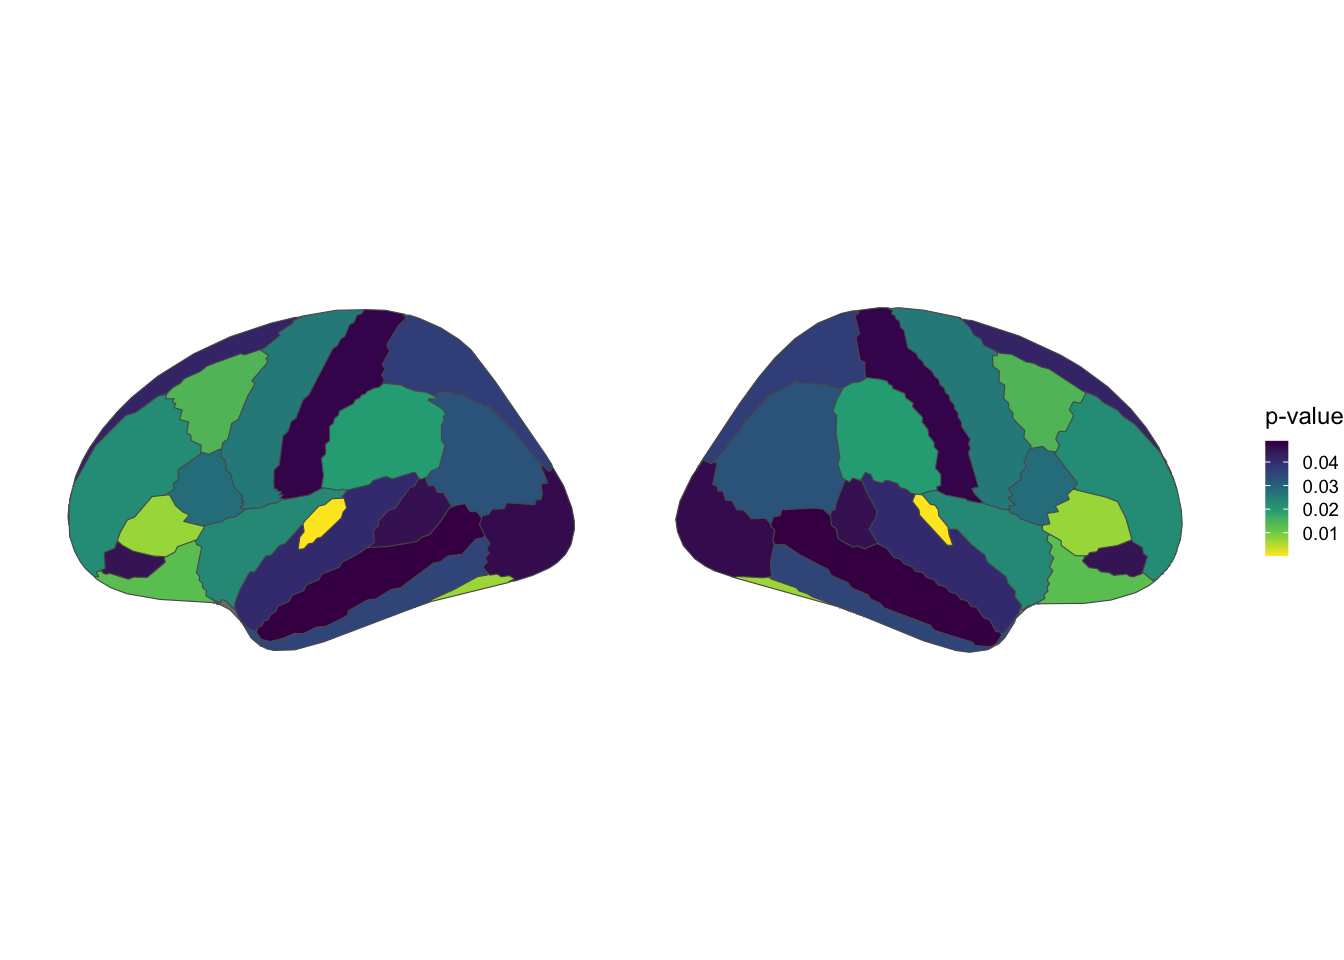
theme_void()library(dplyr)
tibble(
region = atlas_regions(dk()),
p = runif(length(region), 0, 0.05)
) |>
ggplot() +
geom_brain(
atlas = dk(),
aes(fill = p),
position = position_brain(hemi ~ view)
) +
scale_fill_viridis_c(
option = "viridis", direction = -1
) +
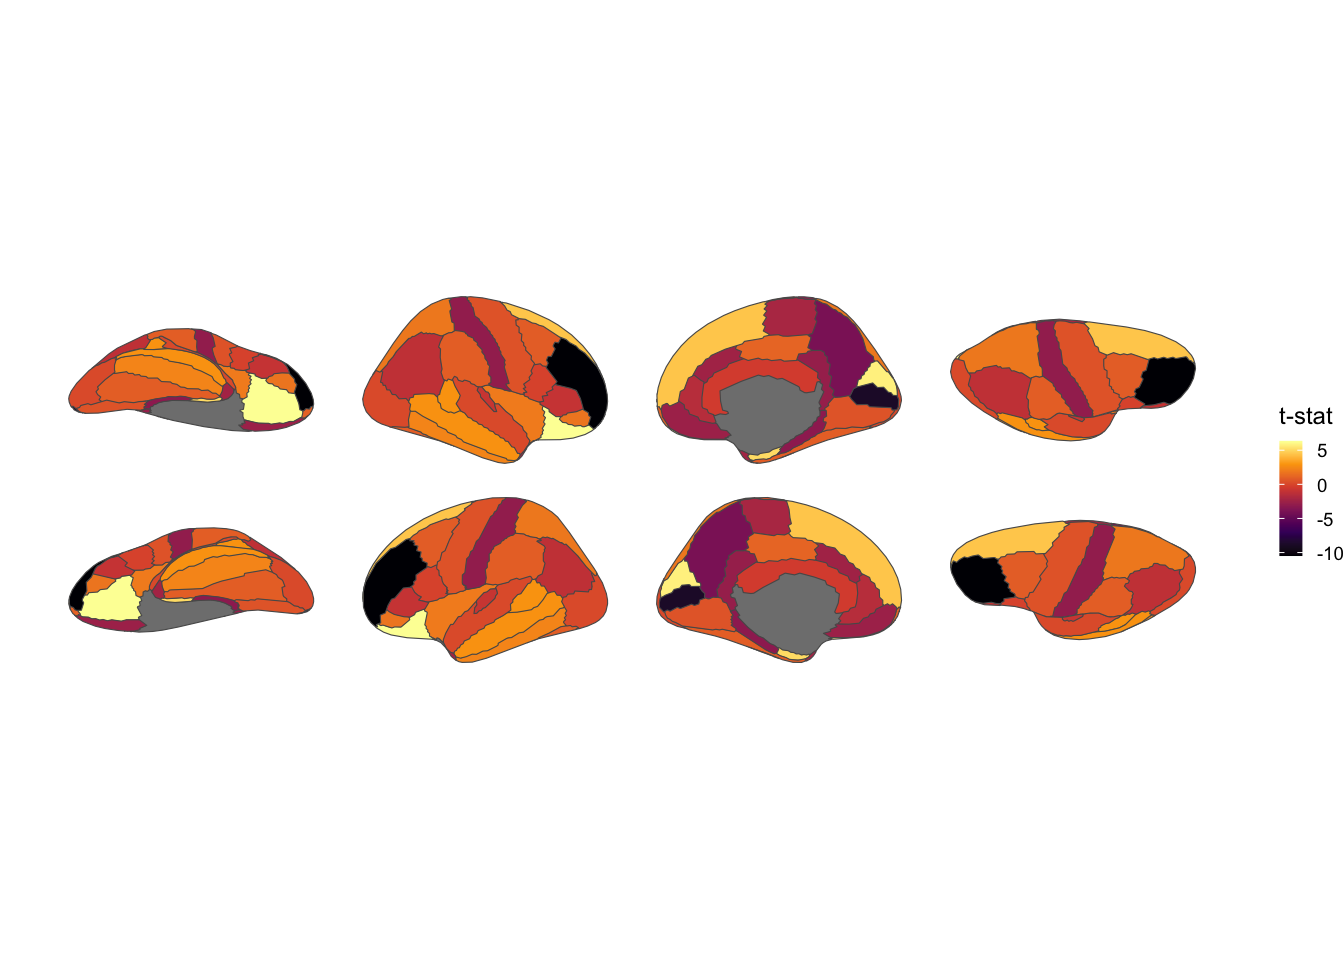
labs(fill = "p-value") +
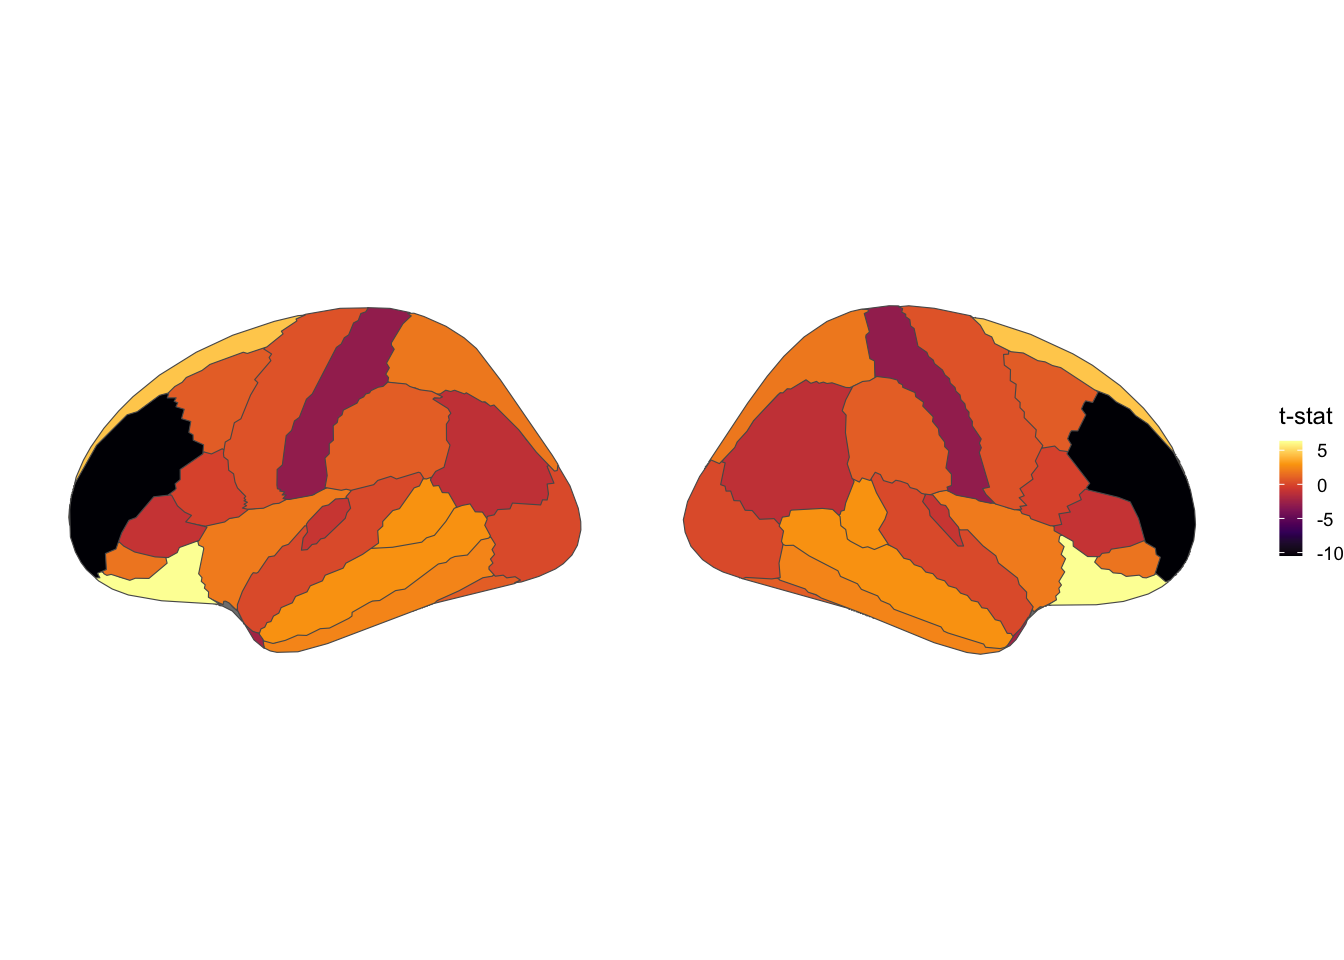
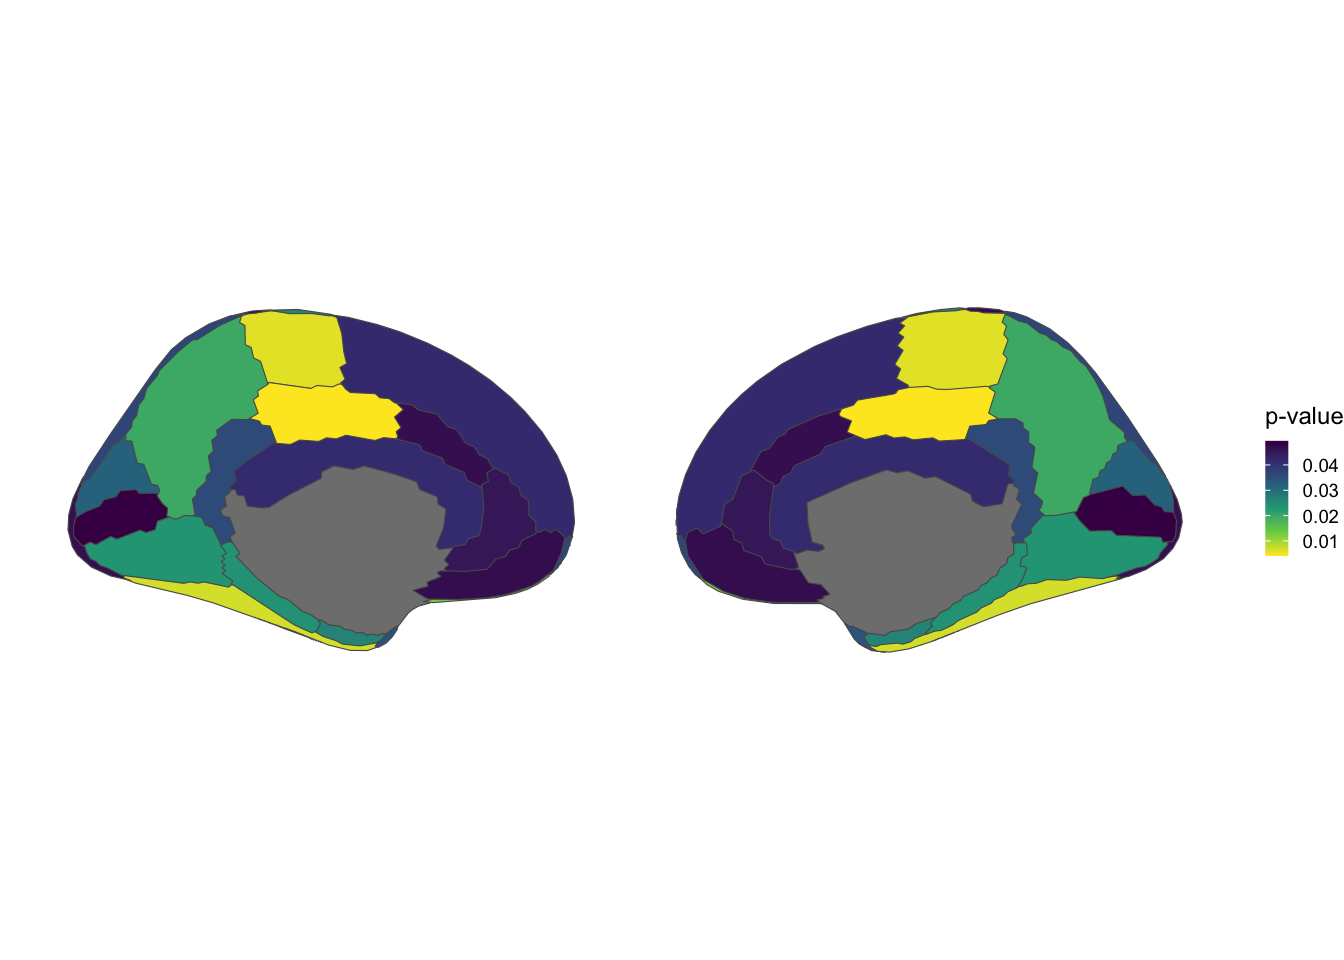
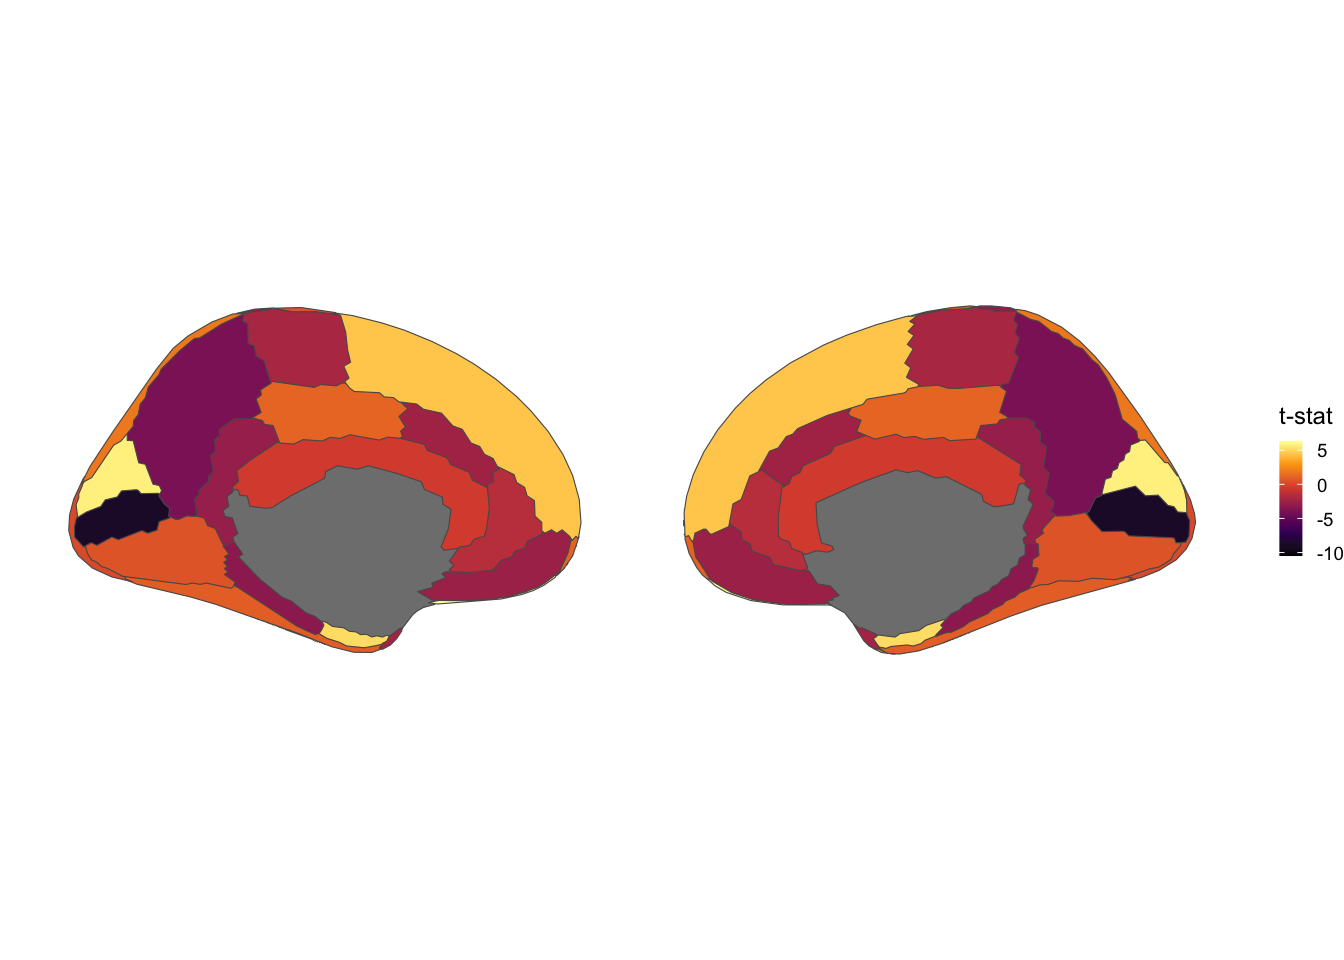
theme_void()tibble(
region = atlas_regions(dk()),
t = rnorm(length(region), 0, 3)
) |>
ggplot() +
geom_brain(
atlas = dk(),
aes(fill = t),
position = position_brain(hemi ~ view)
) +
scale_fill_viridis_c(option = "inferno") +
labs(fill = "t-stat") +
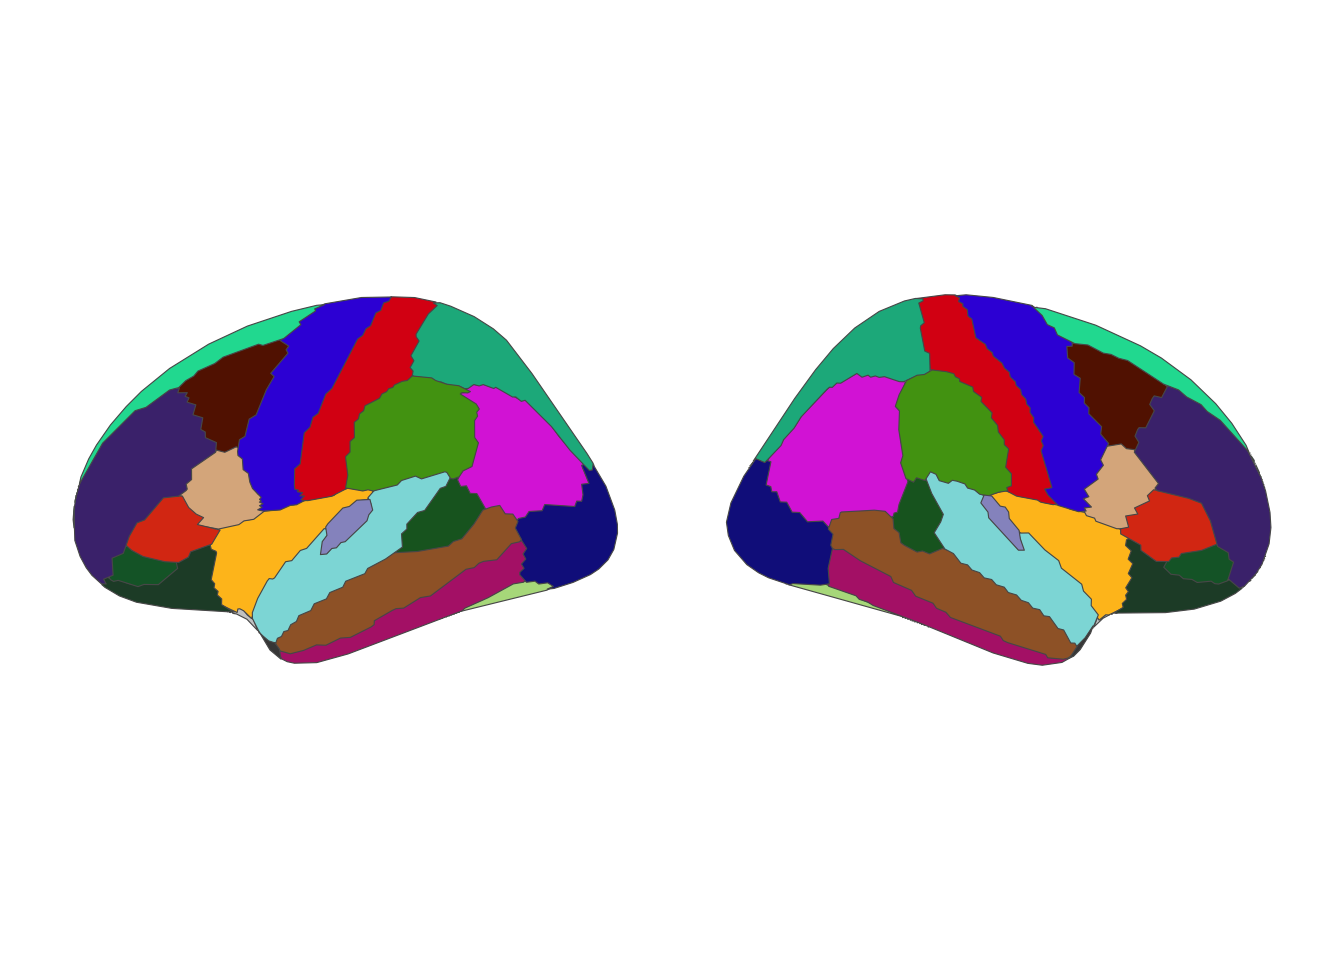
theme_void()ggplot() +
geom_brain(
atlas = dk() |> atlas_view_keep("lateral"),
aes(fill = label),
show.legend = FALSE
) +
scale_fill_manual(
values = atlas_palette(dk()),
na.value = "grey80"
) +
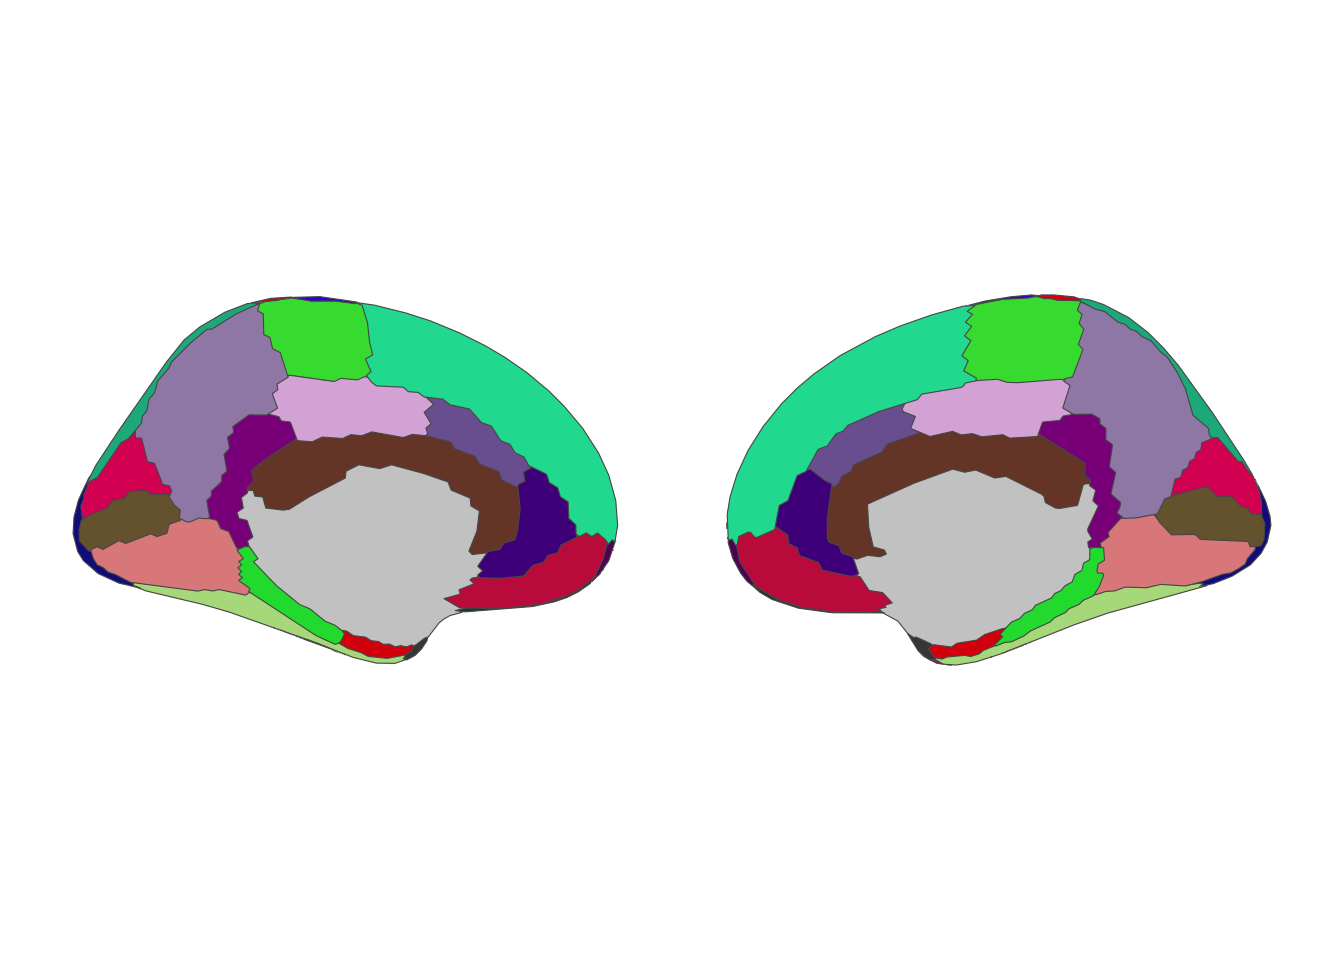
theme_void()ggplot() +
geom_brain(
atlas = dk() |> atlas_view_keep("medial"),
aes(fill = label),
show.legend = FALSE
) +
scale_fill_manual(
values = atlas_palette(dk()),
na.value = "grey80"
) +
theme_void()ggplot() +
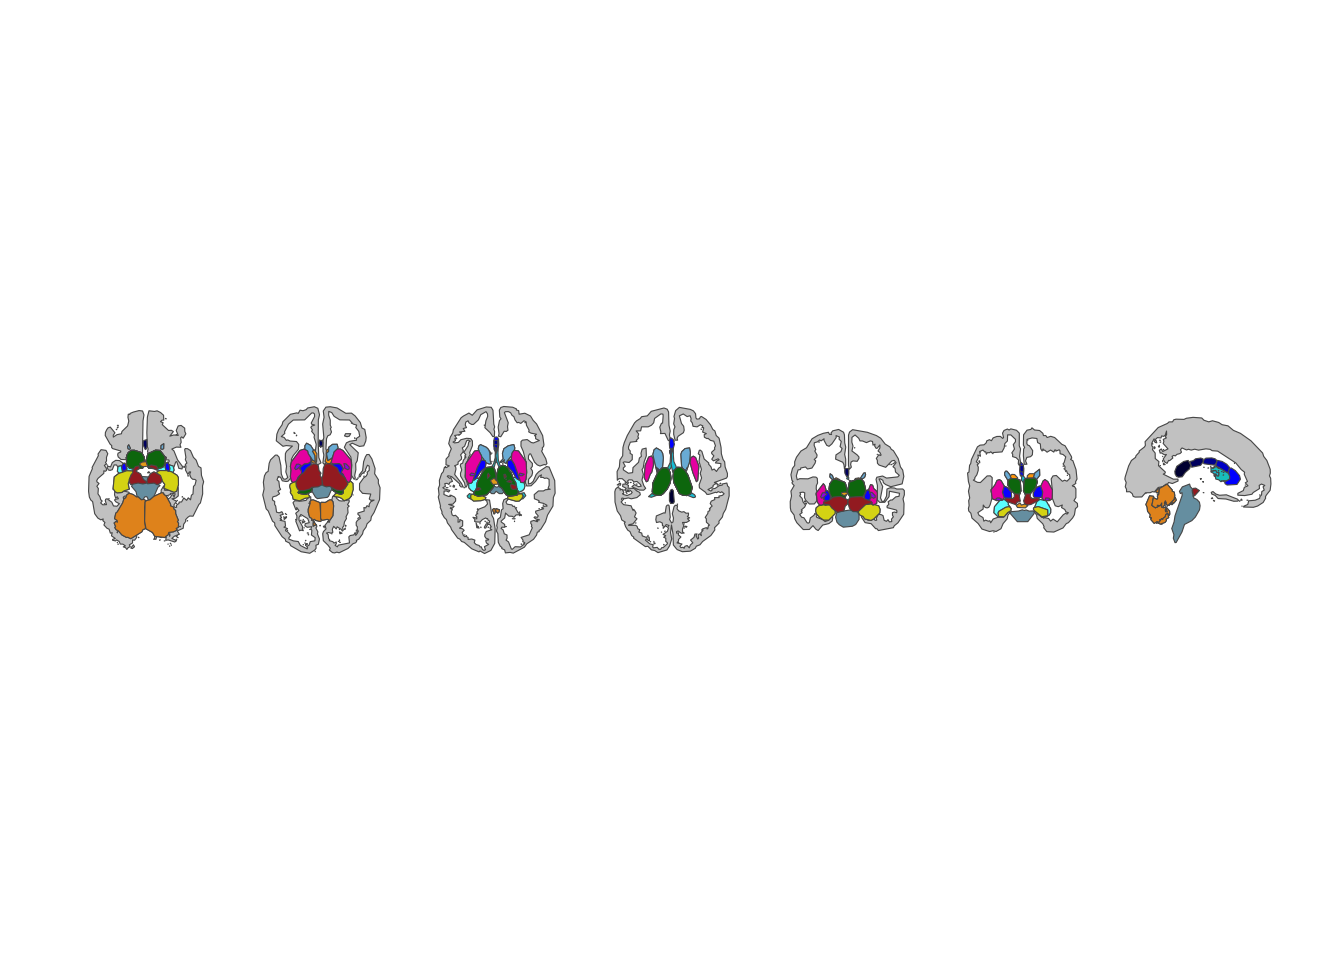
geom_brain(
atlas = aseg(),
aes(fill = label),
position = position_brain(. ~ view),
show.legend = FALSE
) +
scale_fill_manual(
values = atlas_palette(aseg()),
na.value = "grey80"
) +
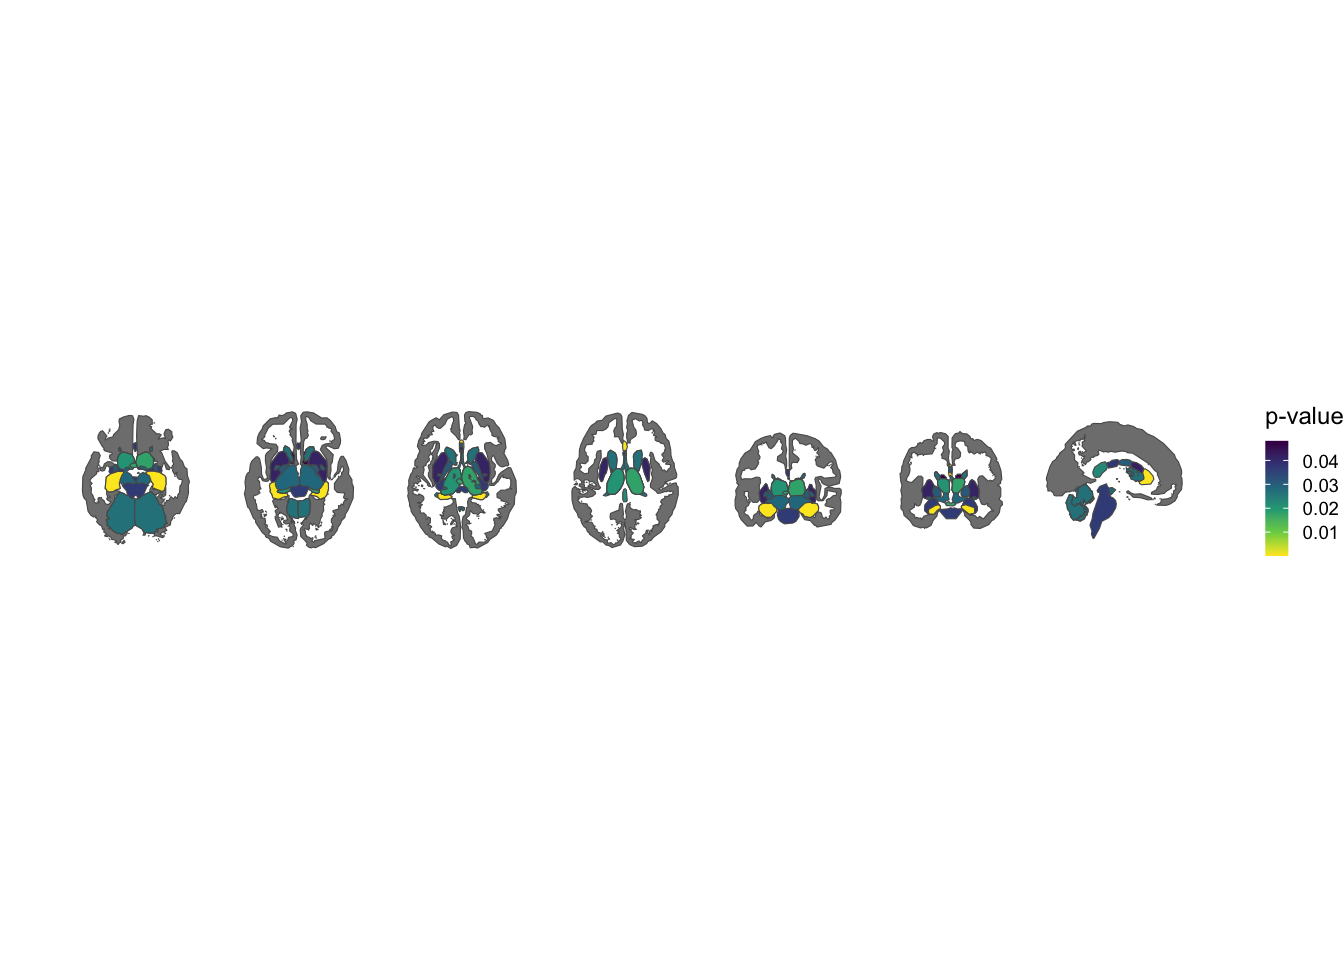
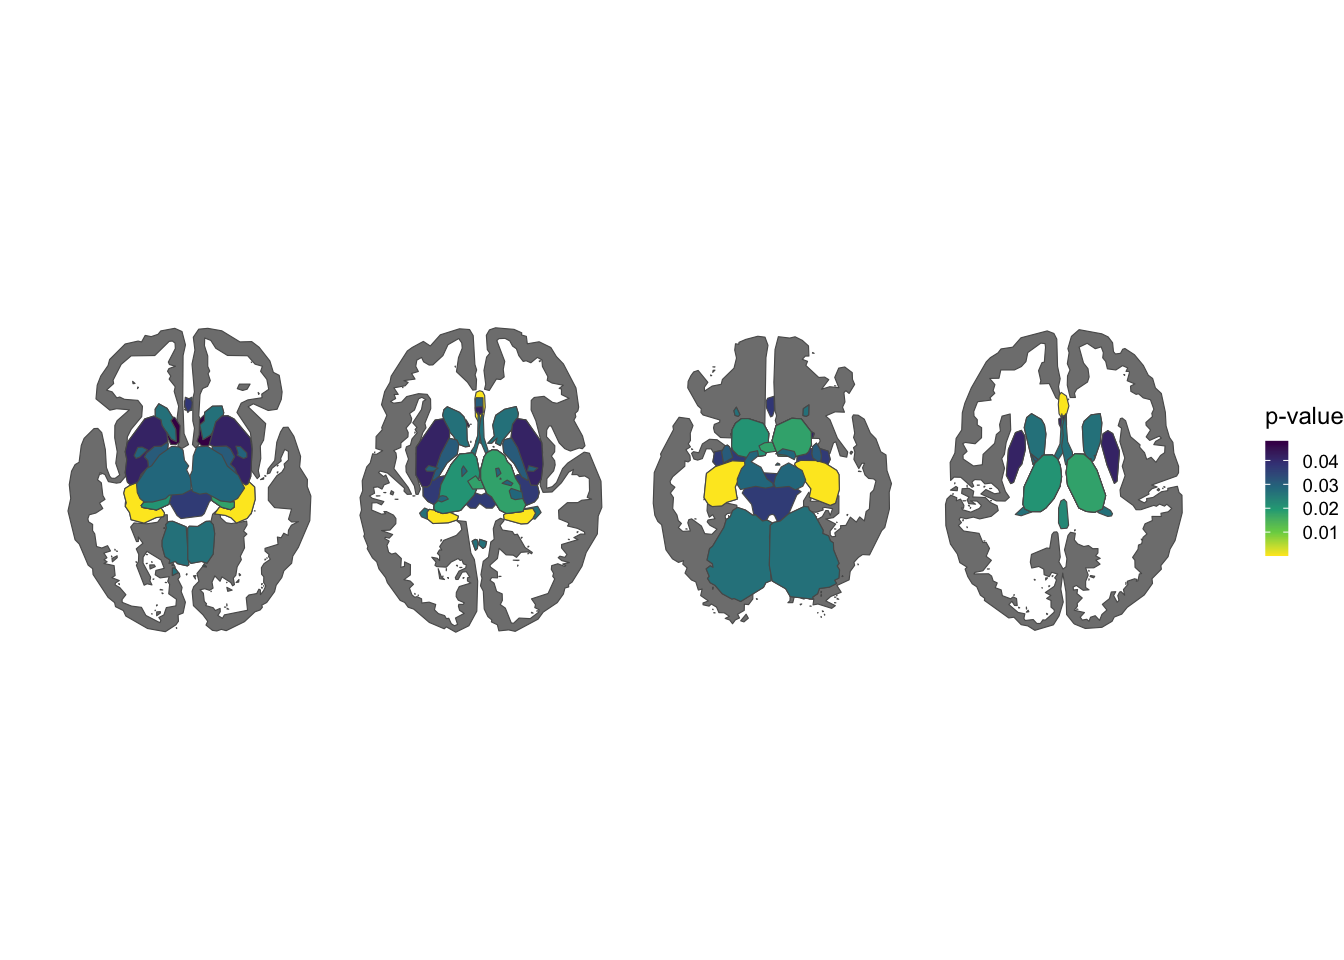
theme_void()tibble(
region = atlas_regions(aseg()),
p = runif(length(region), 0, 0.05)
) |>
ggplot() +
geom_brain(
atlas = aseg(),
aes(fill = p),
position = position_brain(. ~ view)
) +
scale_fill_viridis_c(
option = "viridis", direction = -1
) +
labs(fill = "p-value") +
theme_void()tibble(
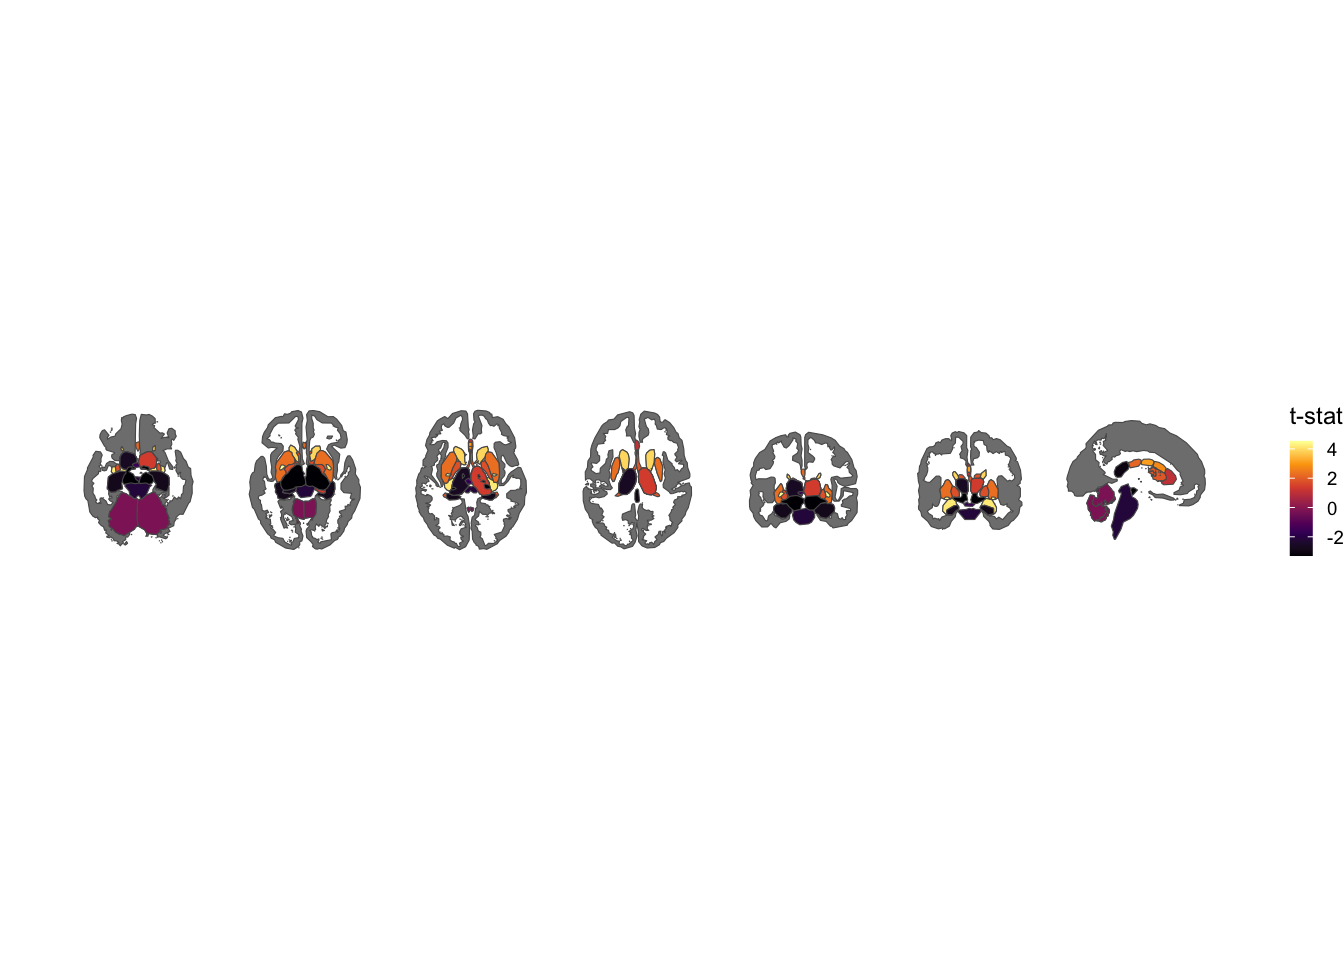
region = atlas_regions(aseg()),
t = rnorm(length(region), 0, 3)
) |>
ggplot() +
geom_brain(
atlas = aseg(),
aes(fill = t),
position = position_brain(. ~ view)
) +
scale_fill_viridis_c(option = "inferno") +
labs(fill = "t-stat") +
theme_void()ggplot() +
geom_brain(
atlas = aseg() |> atlas_view_keep("sagittal"),
aes(fill = label),
show.legend = FALSE
) +
scale_fill_manual(
values = atlas_palette(aseg()),
na.value = "grey80"
) +
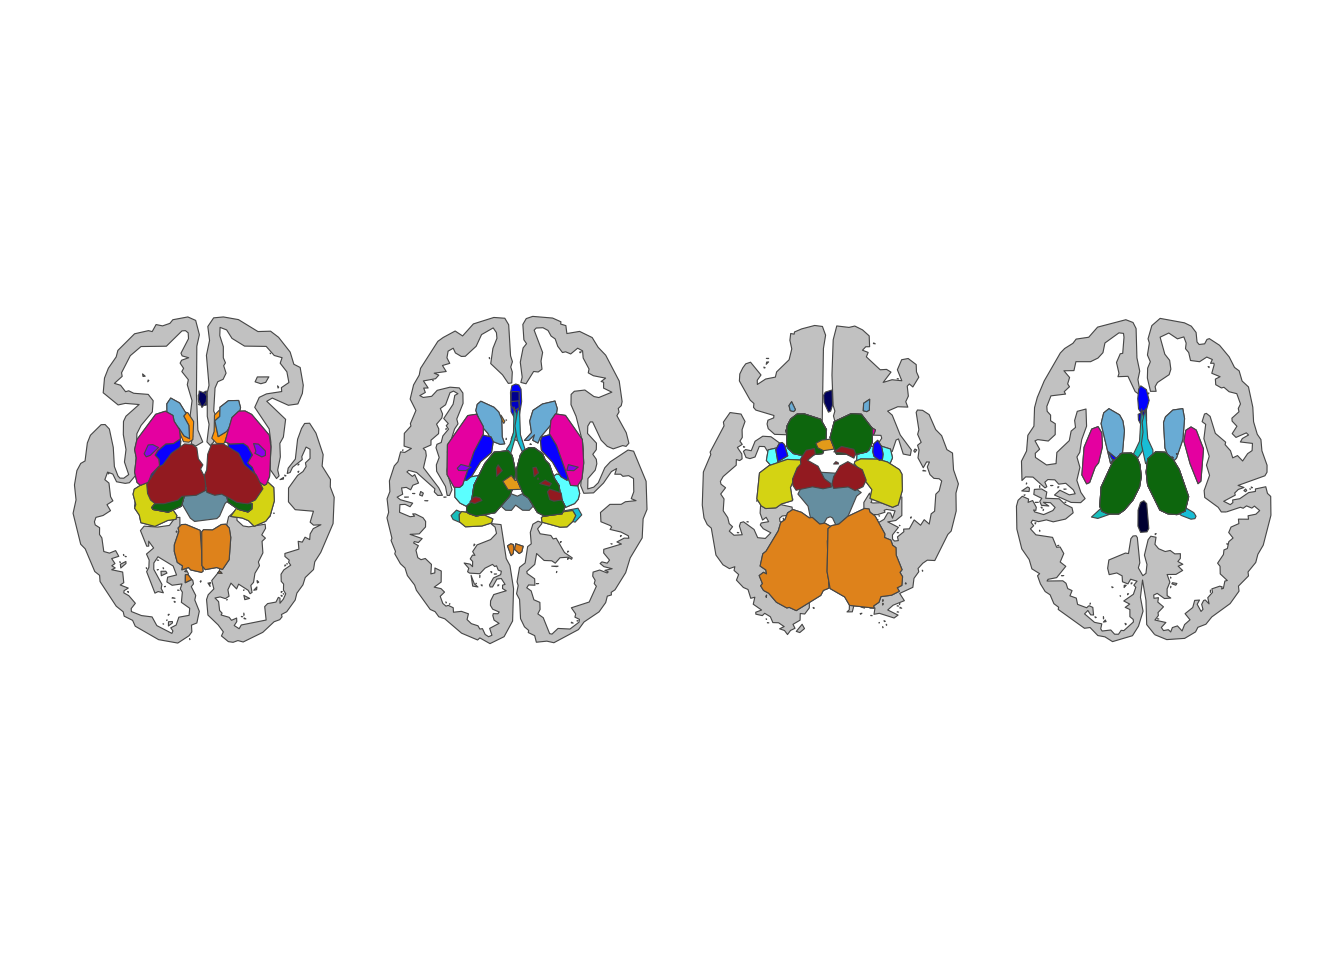
theme_void()ggplot() +
geom_brain(
atlas = aseg() |> atlas_view_keep("axial"),
aes(fill = label),
show.legend = FALSE
) +
scale_fill_manual(
values = atlas_palette(aseg()),
na.value = "grey80"
) +
theme_void()ggplot() +
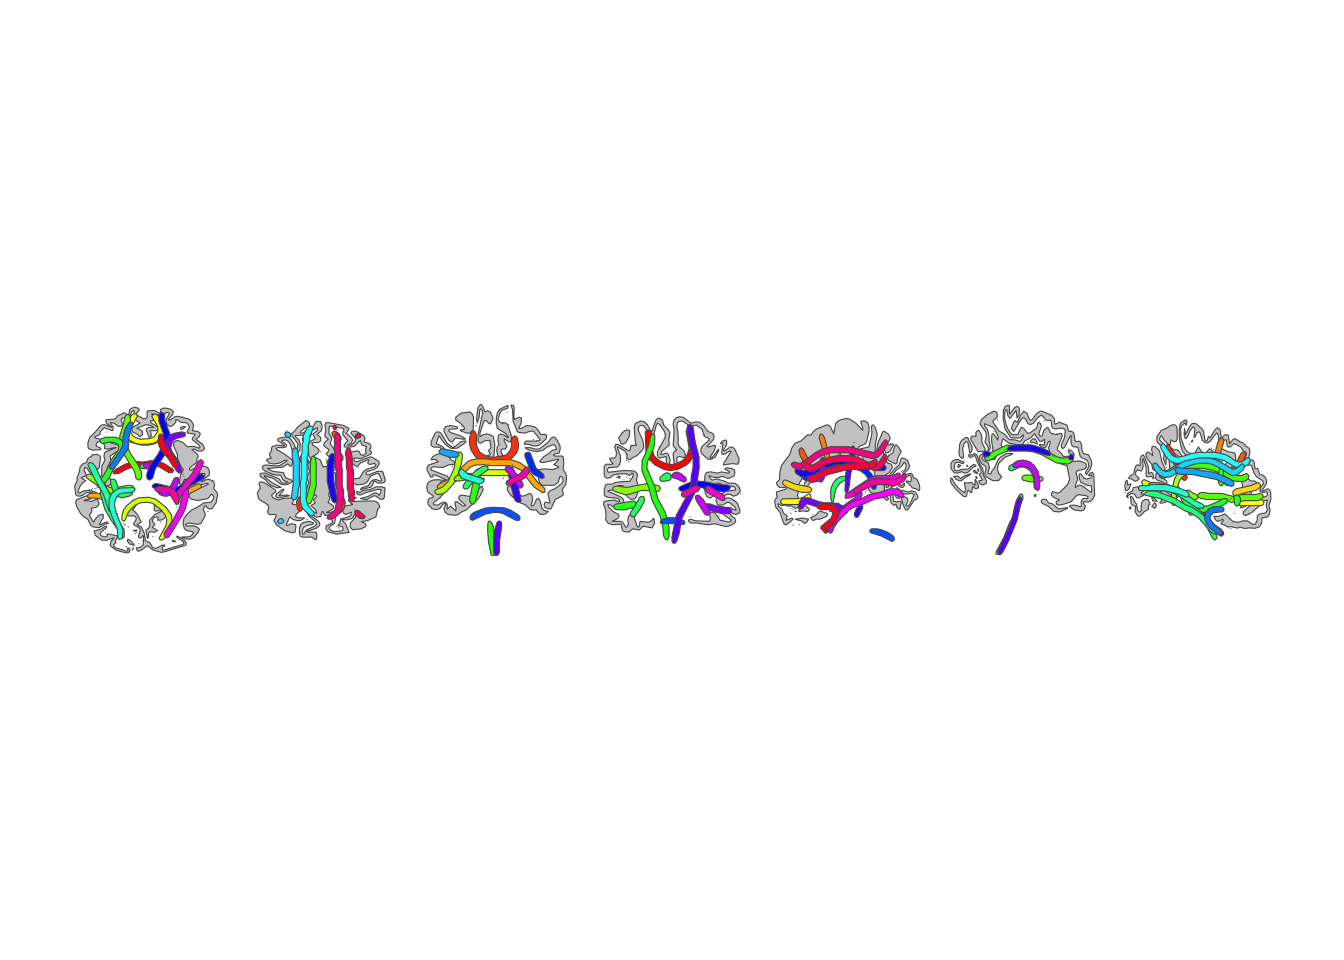
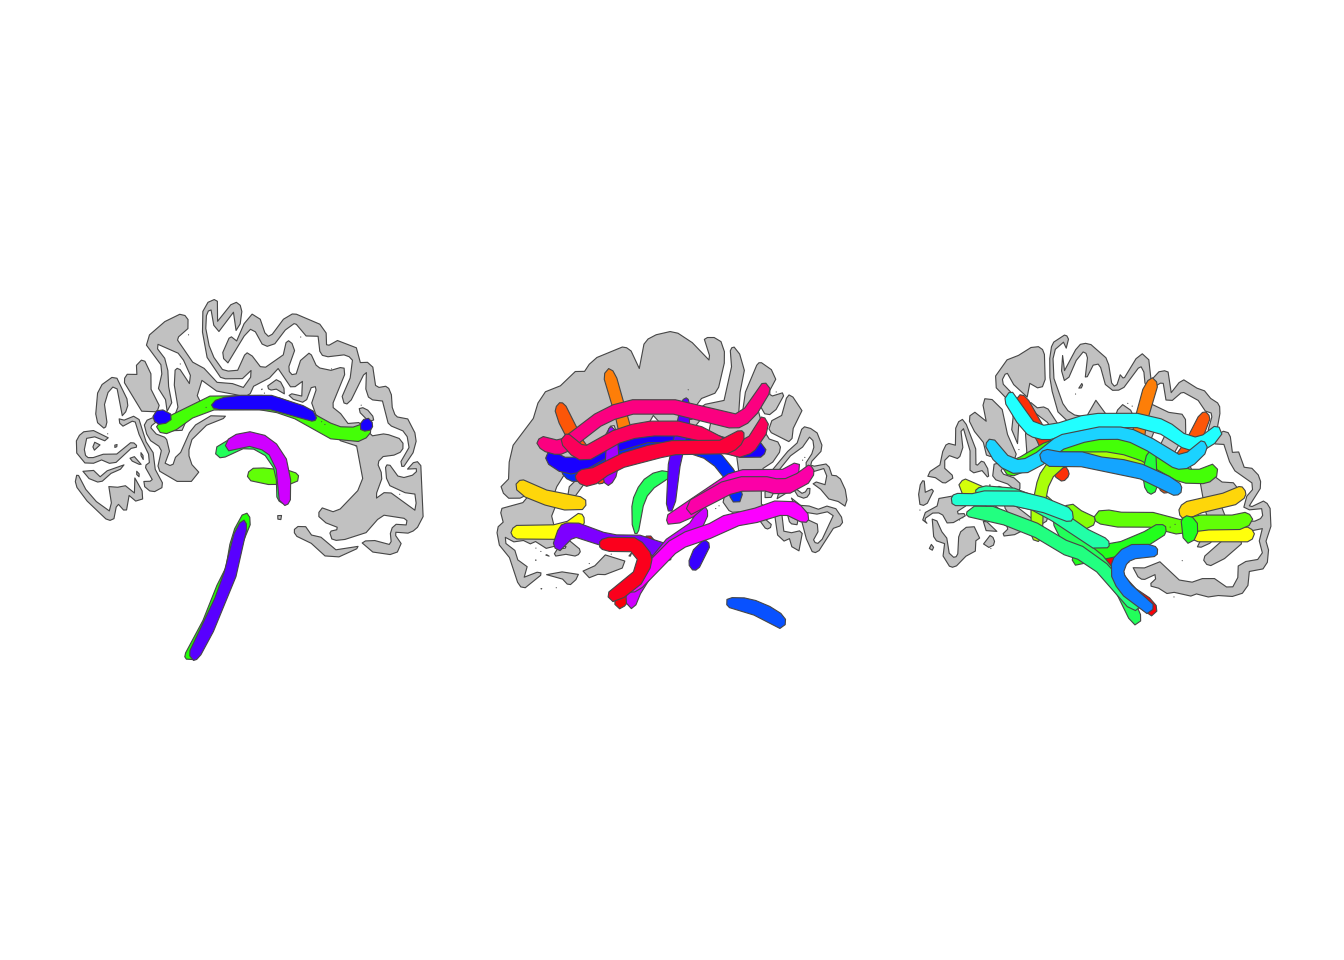
geom_brain(
atlas = tracula(),
aes(fill = label),
position = position_brain(. ~ view),
show.legend = FALSE
) +
scale_fill_manual(
values = atlas_palette(tracula()),
na.value = "grey80"
) +
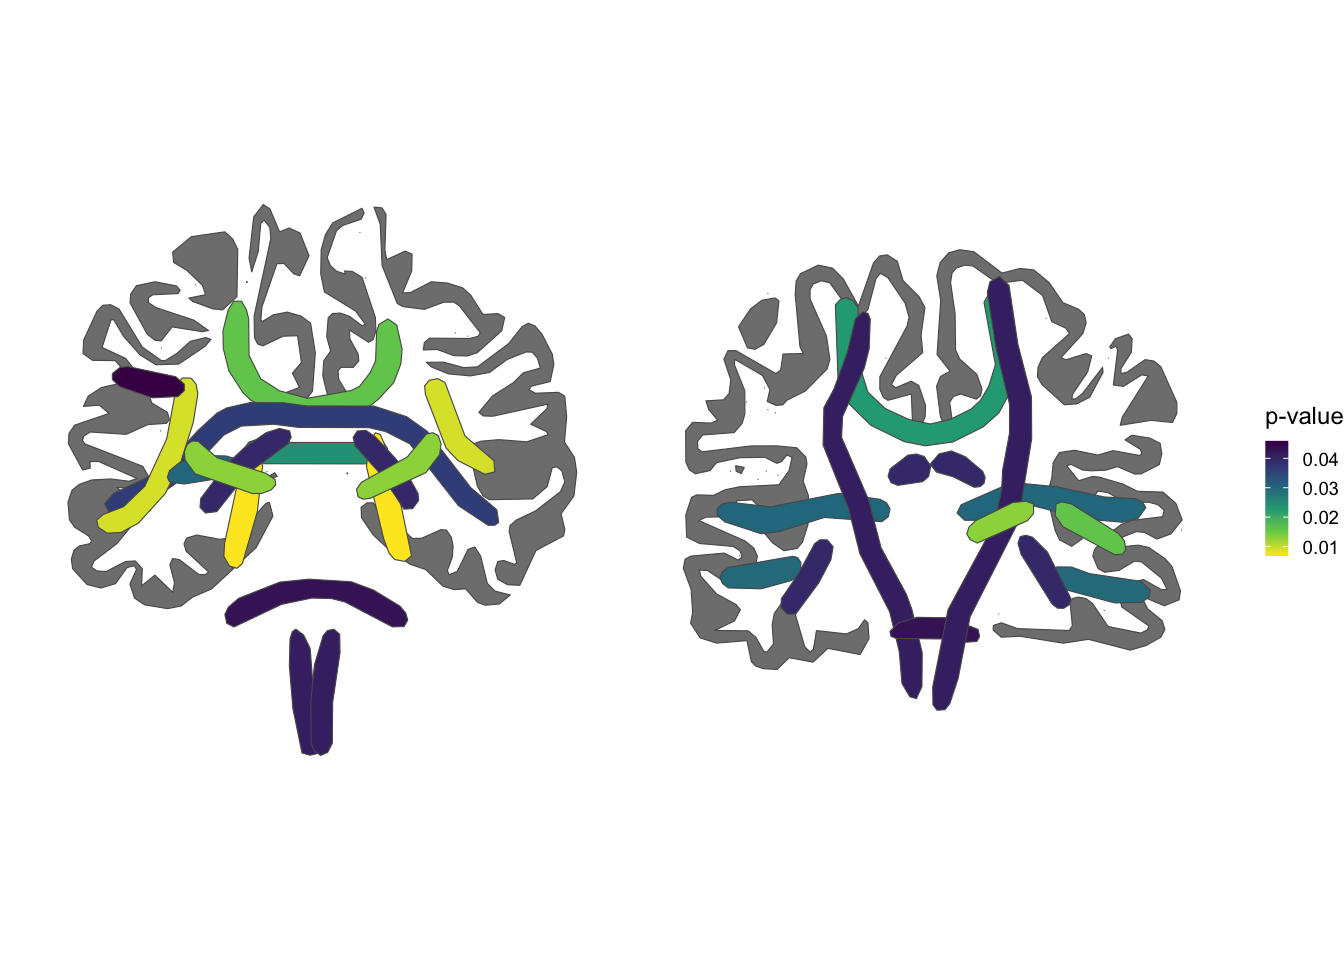
theme_void()tibble(
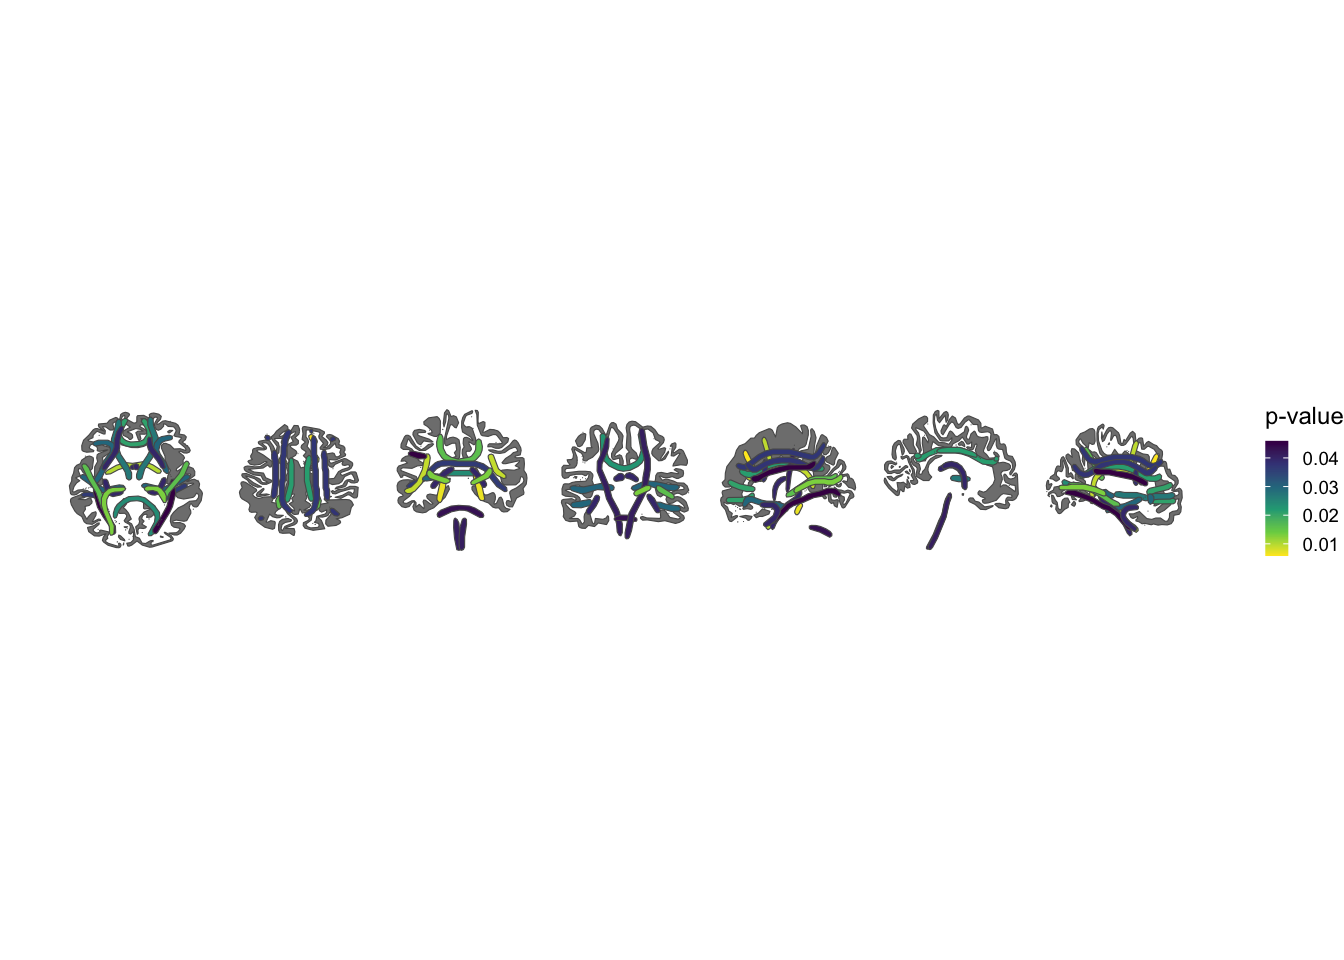
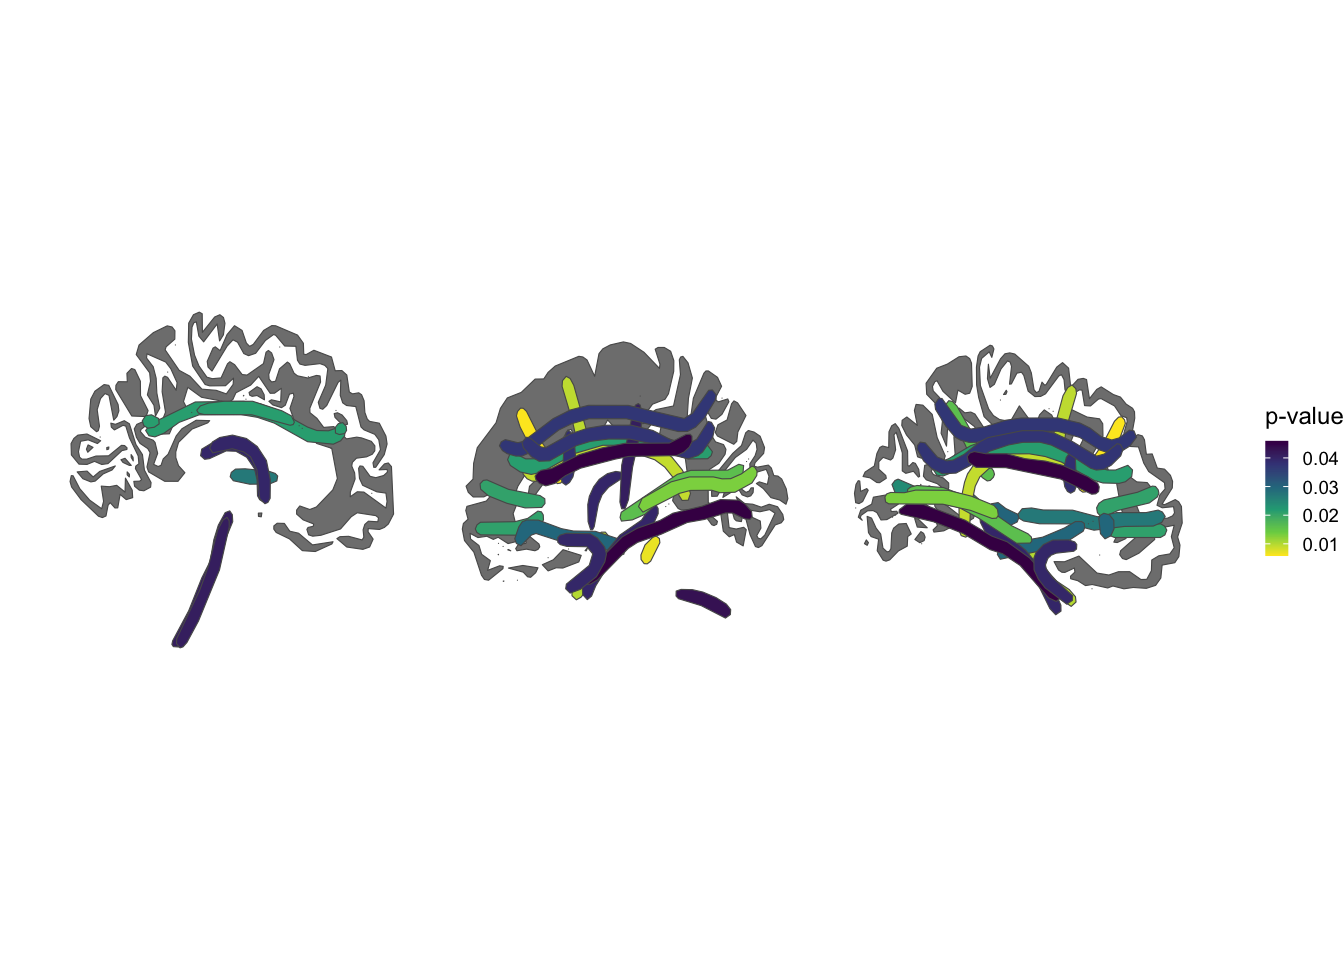
region = atlas_regions(tracula()),
p = runif(length(region), 0, 0.05)
) |>
ggplot() +
geom_brain(
atlas = tracula(),
aes(fill = p),
position = position_brain(. ~ view)
) +
scale_fill_viridis_c(
option = "viridis", direction = -1
) +
labs(fill = "p-value") +
theme_void()tibble(
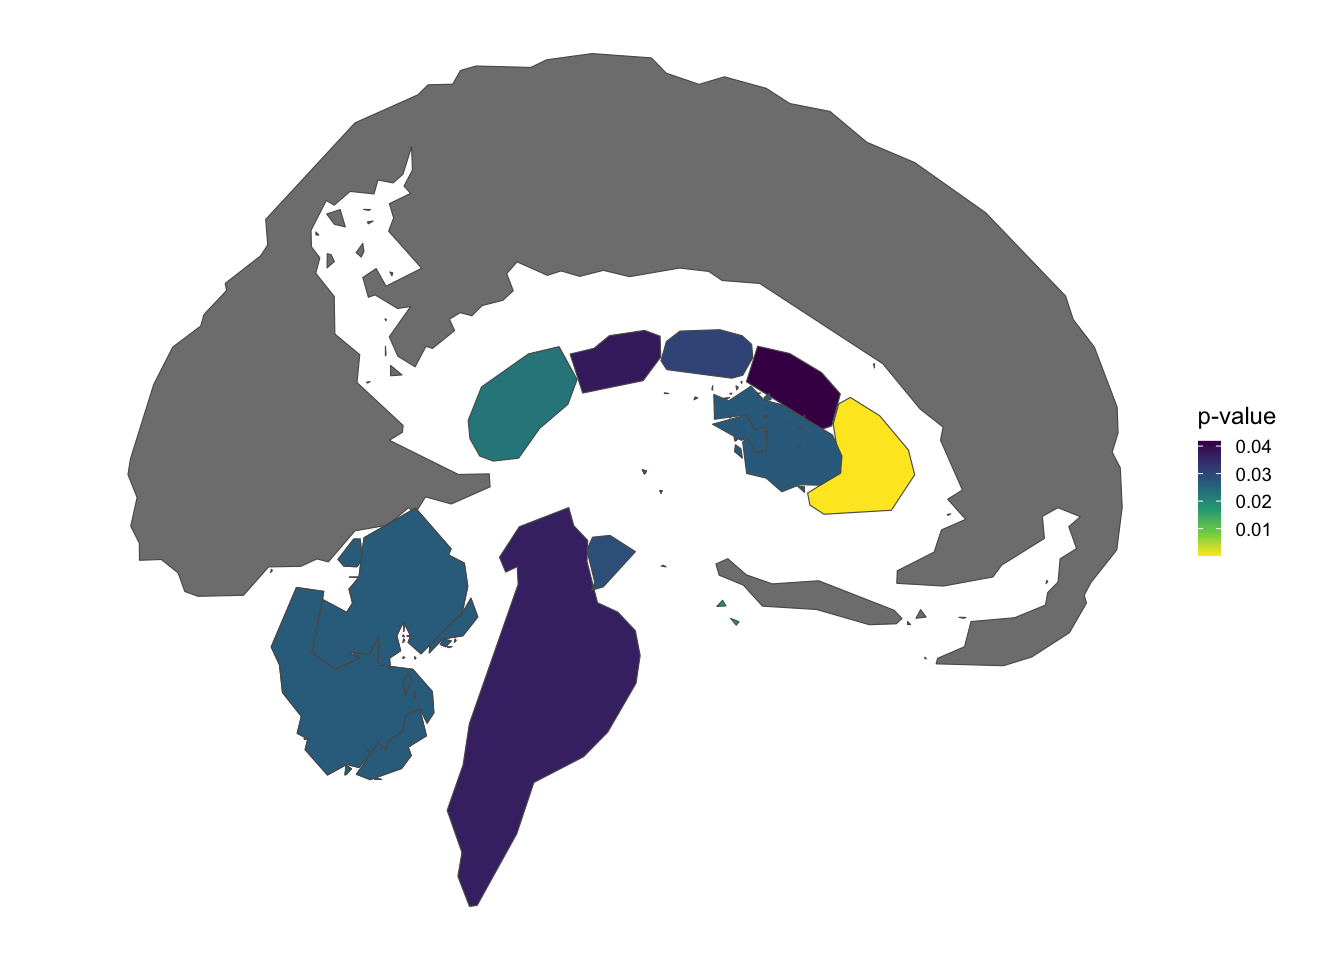
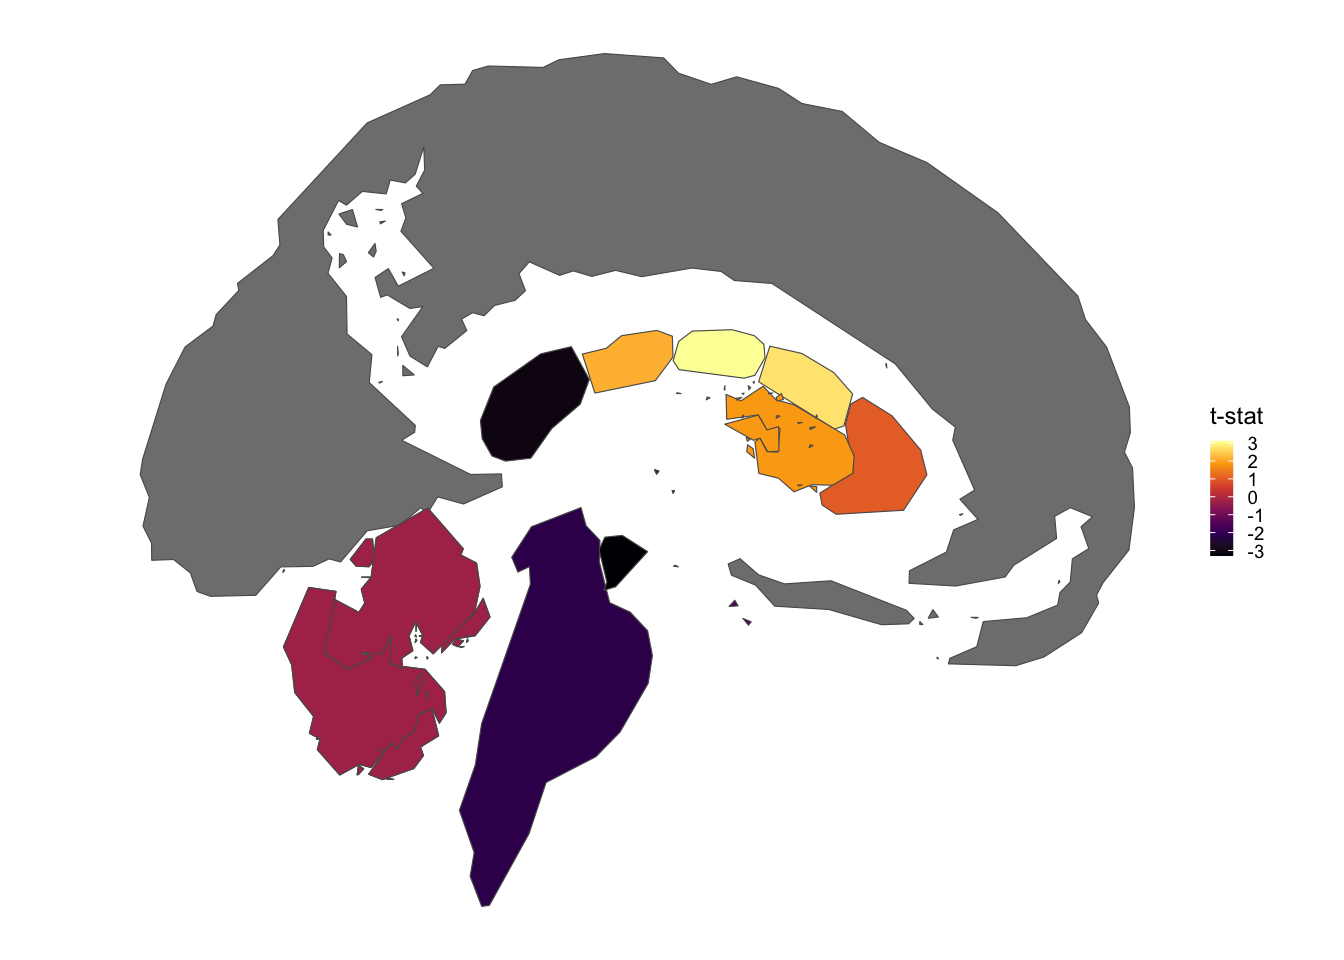
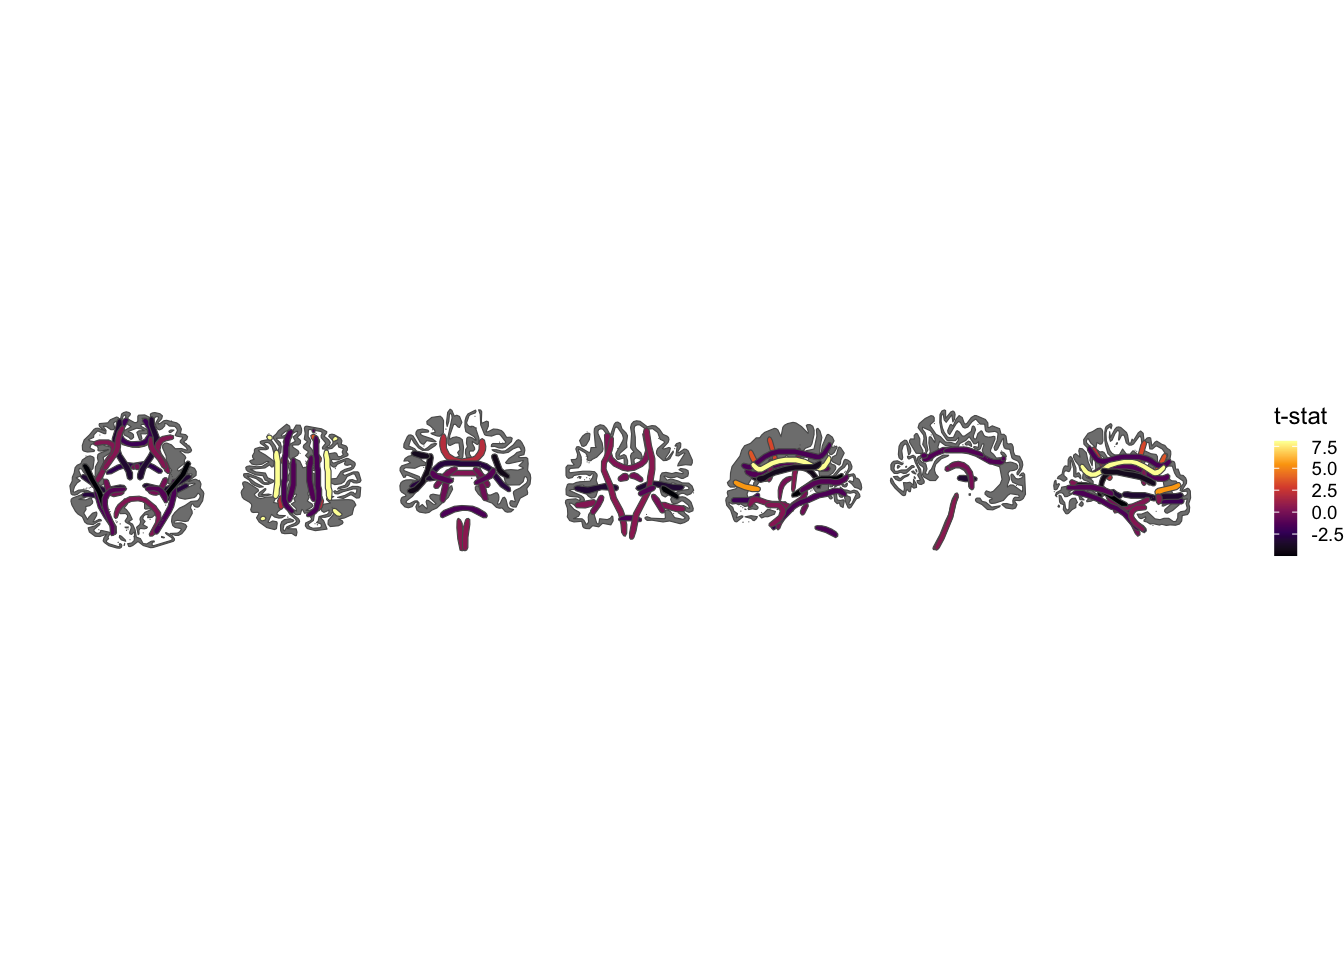
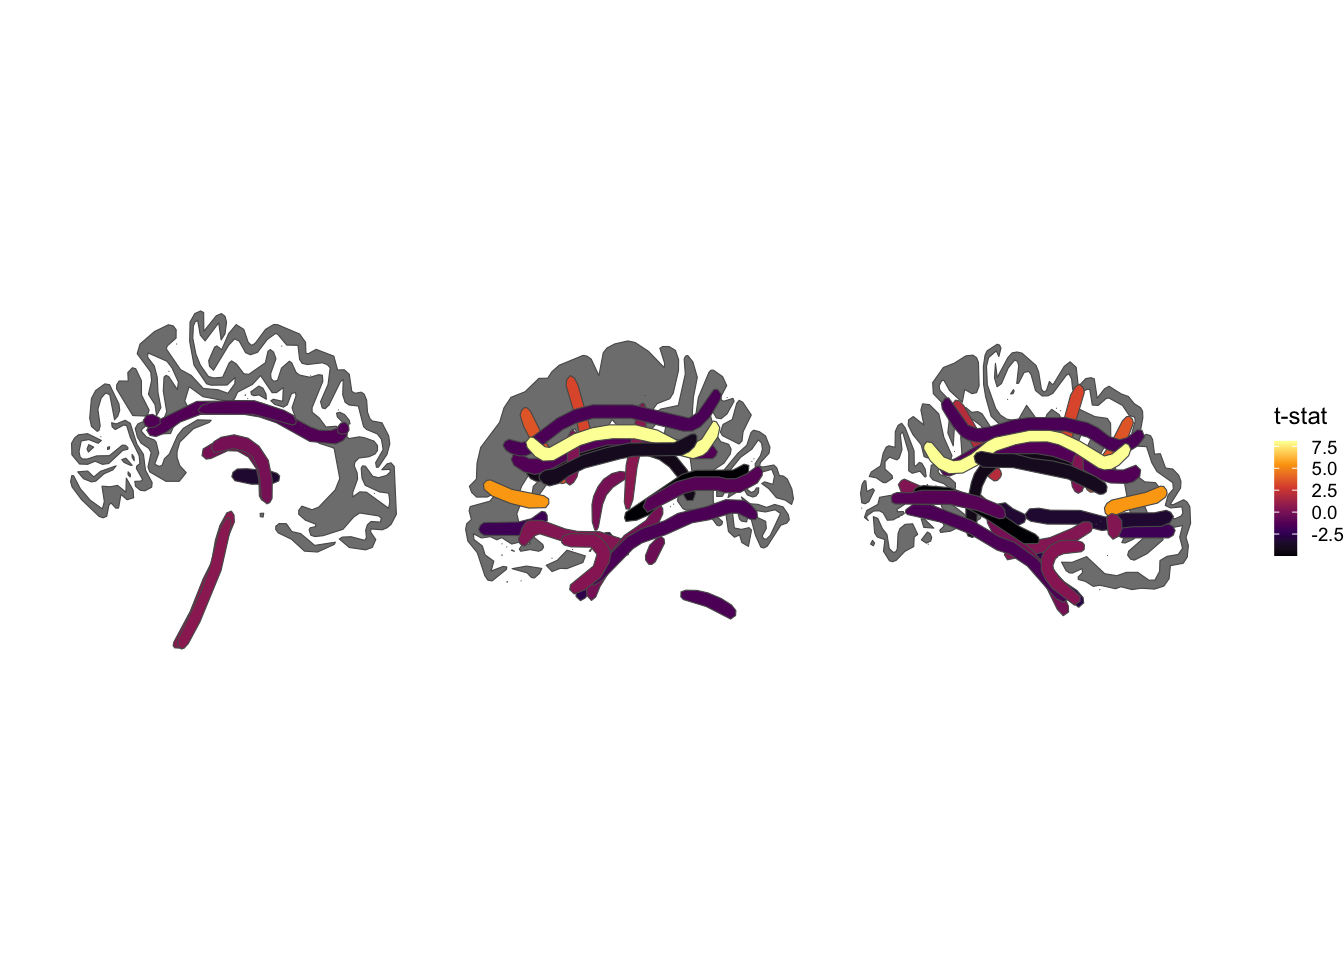
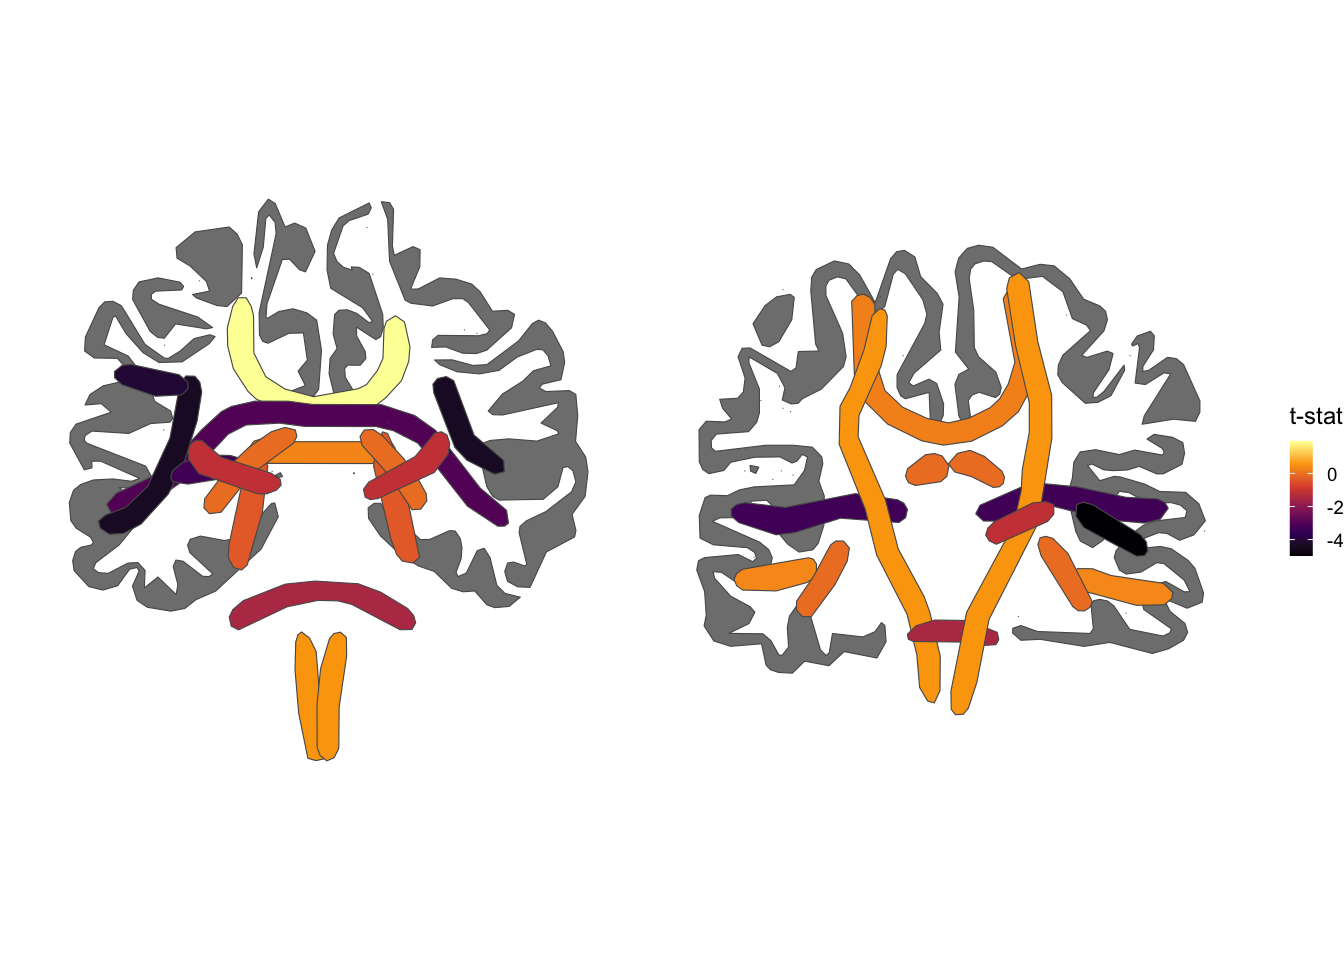
region = atlas_regions(tracula()),
t = rnorm(length(region), 0, 3)
) |>
ggplot() +
geom_brain(
atlas = tracula(),
aes(fill = t),
position = position_brain(. ~ view)
) +
scale_fill_viridis_c(option = "inferno") +
labs(fill = "t-stat") +
theme_void()ggplot() +
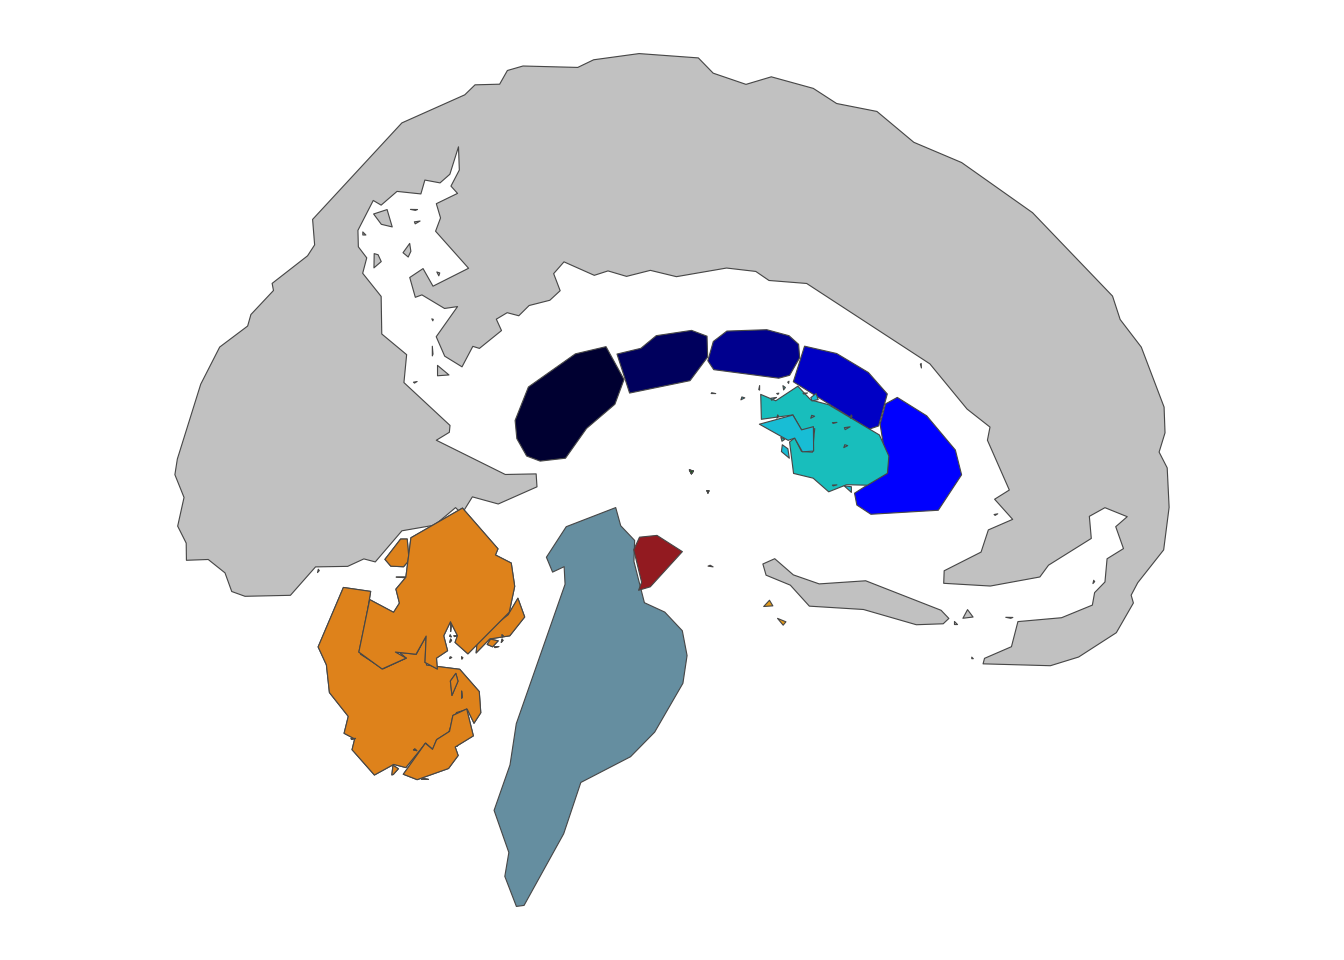
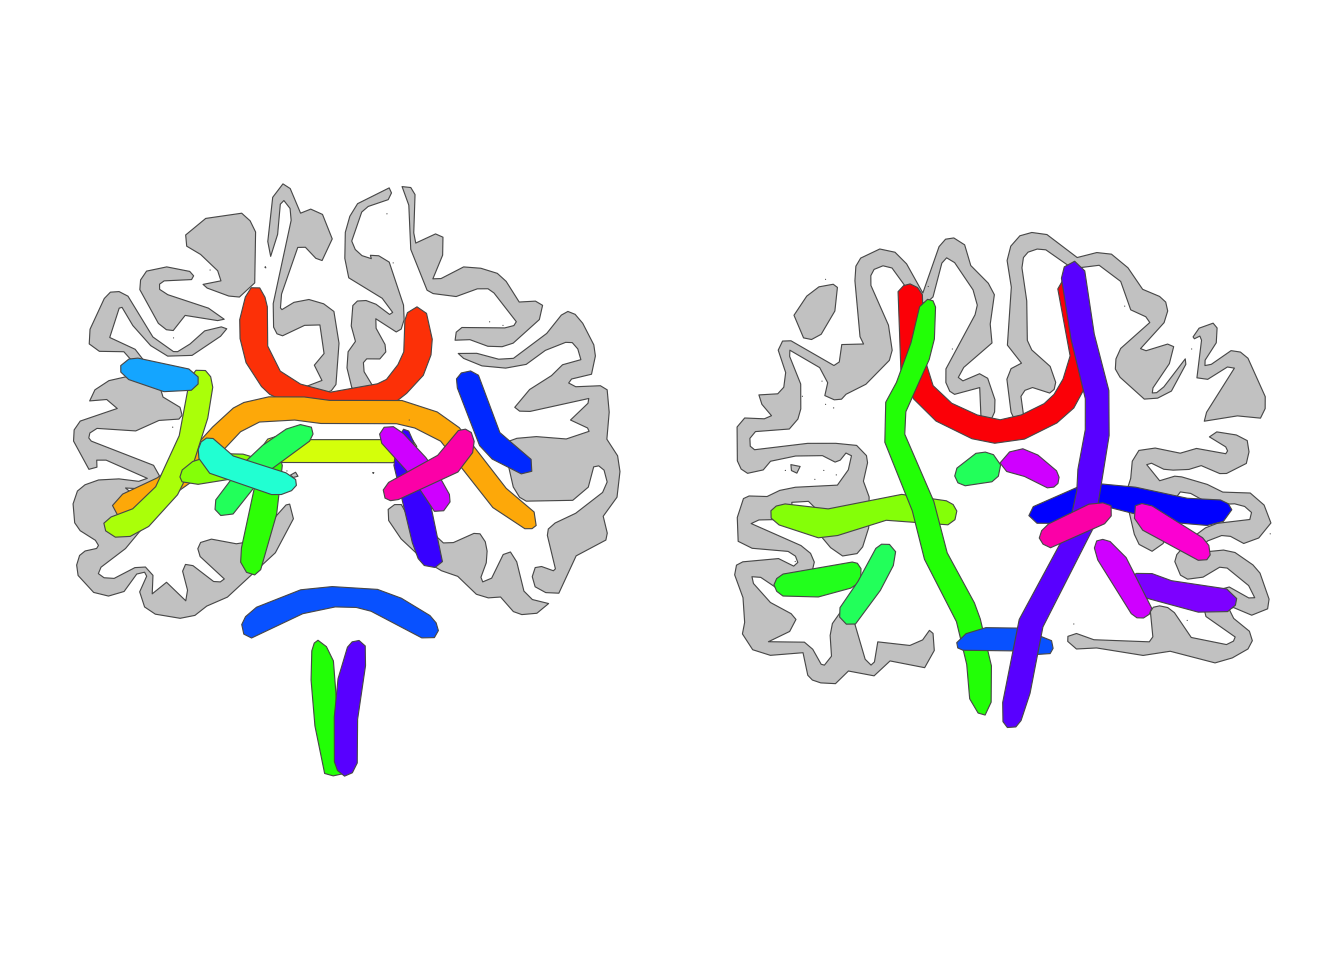
geom_brain(
atlas = tracula() |> atlas_view_keep("sagittal"),
aes(fill = label),
show.legend = FALSE
) +
scale_fill_manual(
values = atlas_palette(tracula()),
na.value = "grey80"
) +
theme_void()ggplot() +
geom_brain(
atlas = tracula() |> atlas_view_keep("coronal"),
aes(fill = label),
show.legend = FALSE
) +
scale_fill_manual(
values = atlas_palette(tracula()),
na.value = "grey80"
) +
theme_void()