from plotnine import ggplot
from ggsegpy import geom_brain, dk
ggplot() + geom_brain(atlas=dk())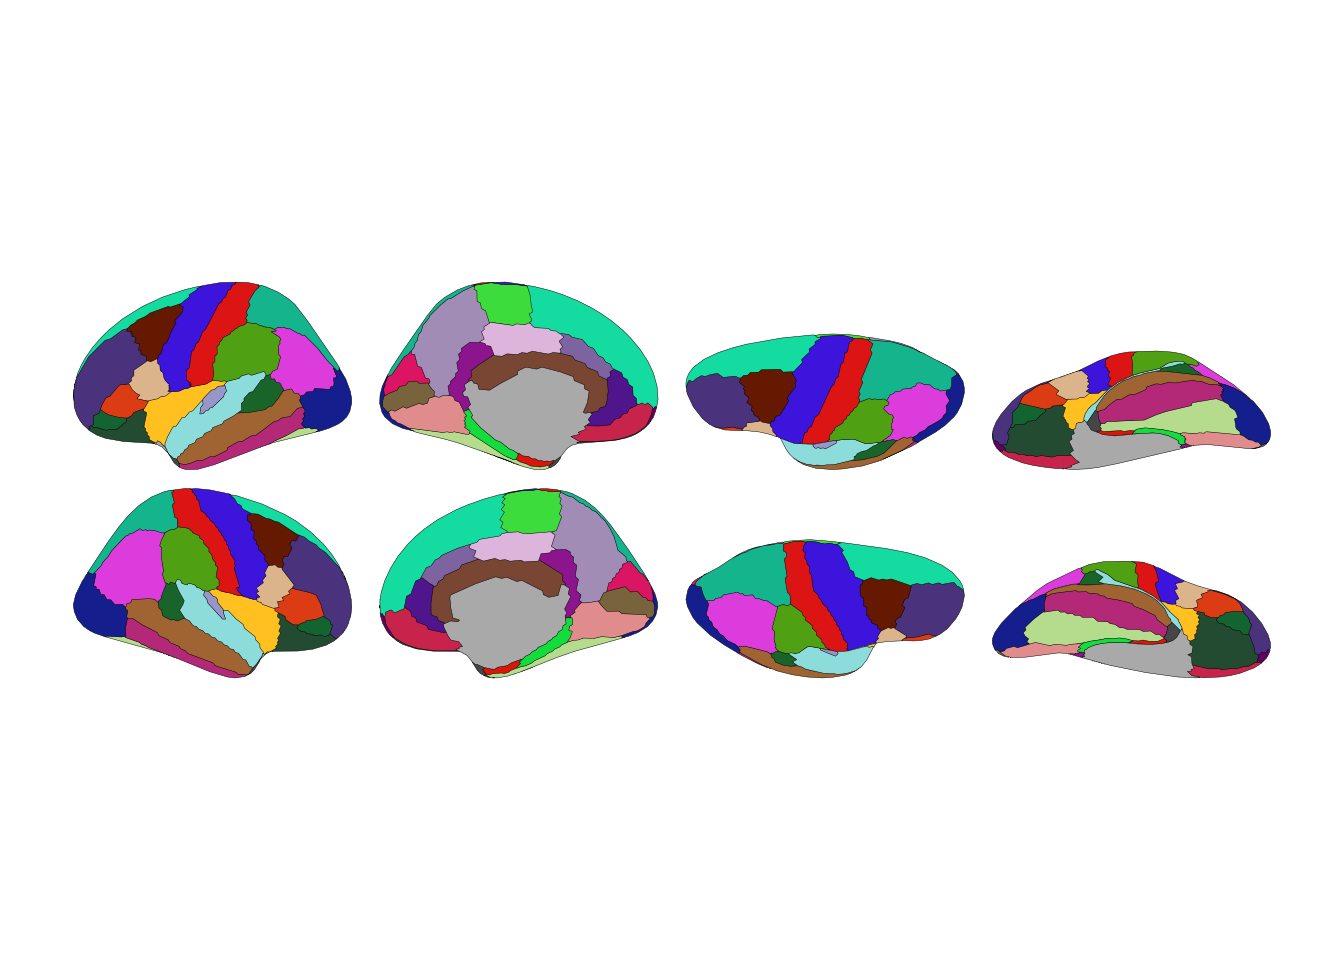
Brain atlas visualization in Python
Three lines to visualize a brain atlas:
from plotnine import ggplot
from ggsegpy import geom_brain, dk
ggplot() + geom_brain(atlas=dk())
ggsegpy is a Python port of the R ggseg ecosystem. It provides 2D visualization with plotnine and 3D interactive visualization with Plotly.
pip install ggsegpyThree atlases ship with the package:
| Atlas | Type | Regions |
|---|---|---|
dk() |
Cortical | Desikan-Killiany parcellation (34 × 2 hemispheres) |
aseg() |
Subcortical | FreeSurfer subcortical segmentation |
tracula() |
White matter | TRACULA tract atlas |
Each works in both 2D and 3D:
from ggsegpy import aseg
ggplot() + geom_brain(atlas=aseg())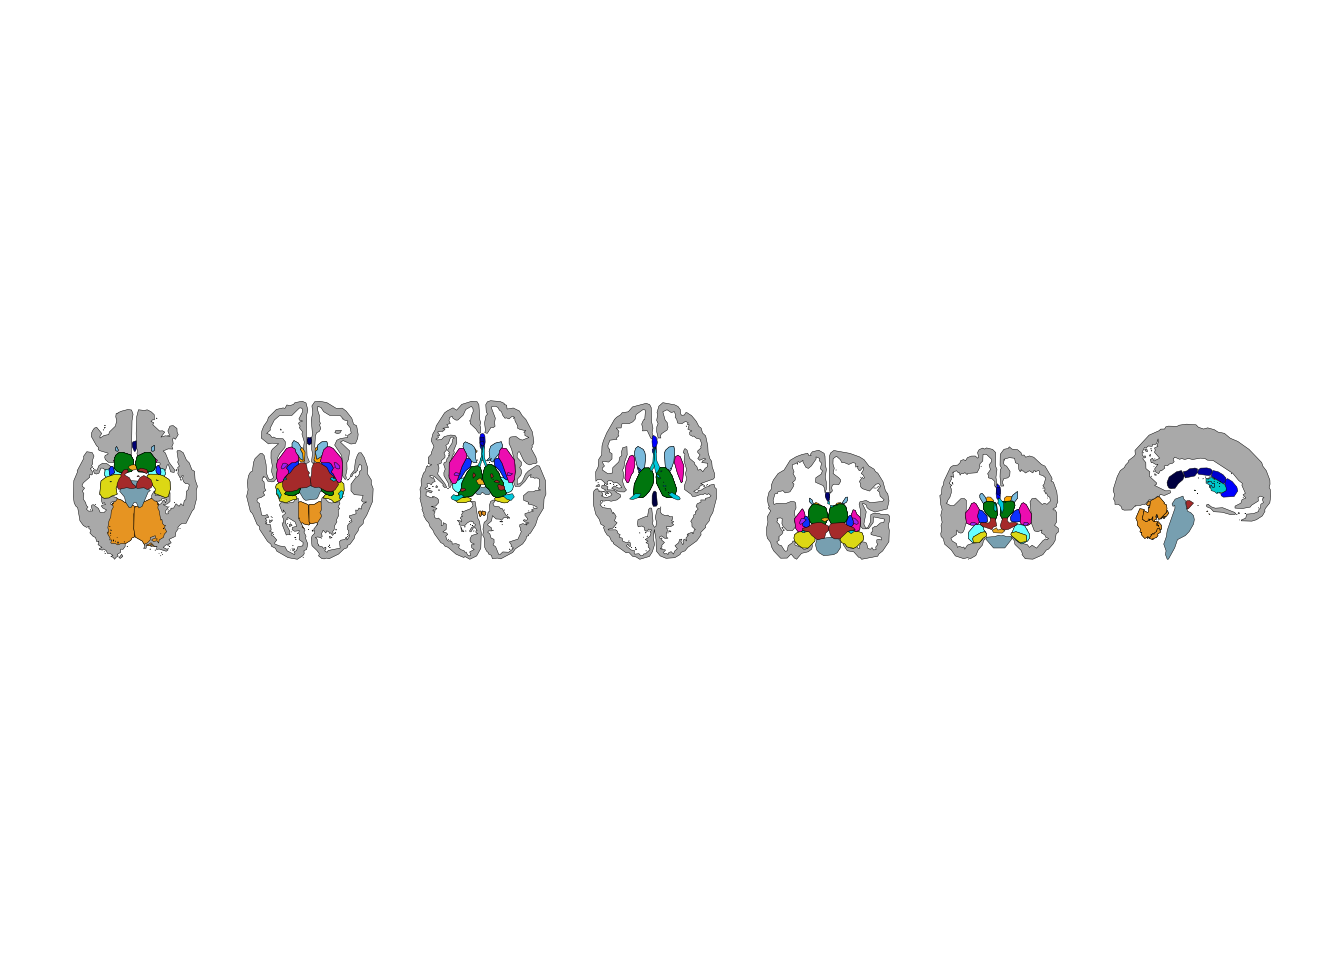
from ggsegpy import ggseg3d, aseg, pan_camera, add_glassbrain
fig = ggseg3d(atlas=aseg())
fig = add_glassbrain(fig, opacity=0.1)
fig = pan_camera(fig, "left lateral")
fig