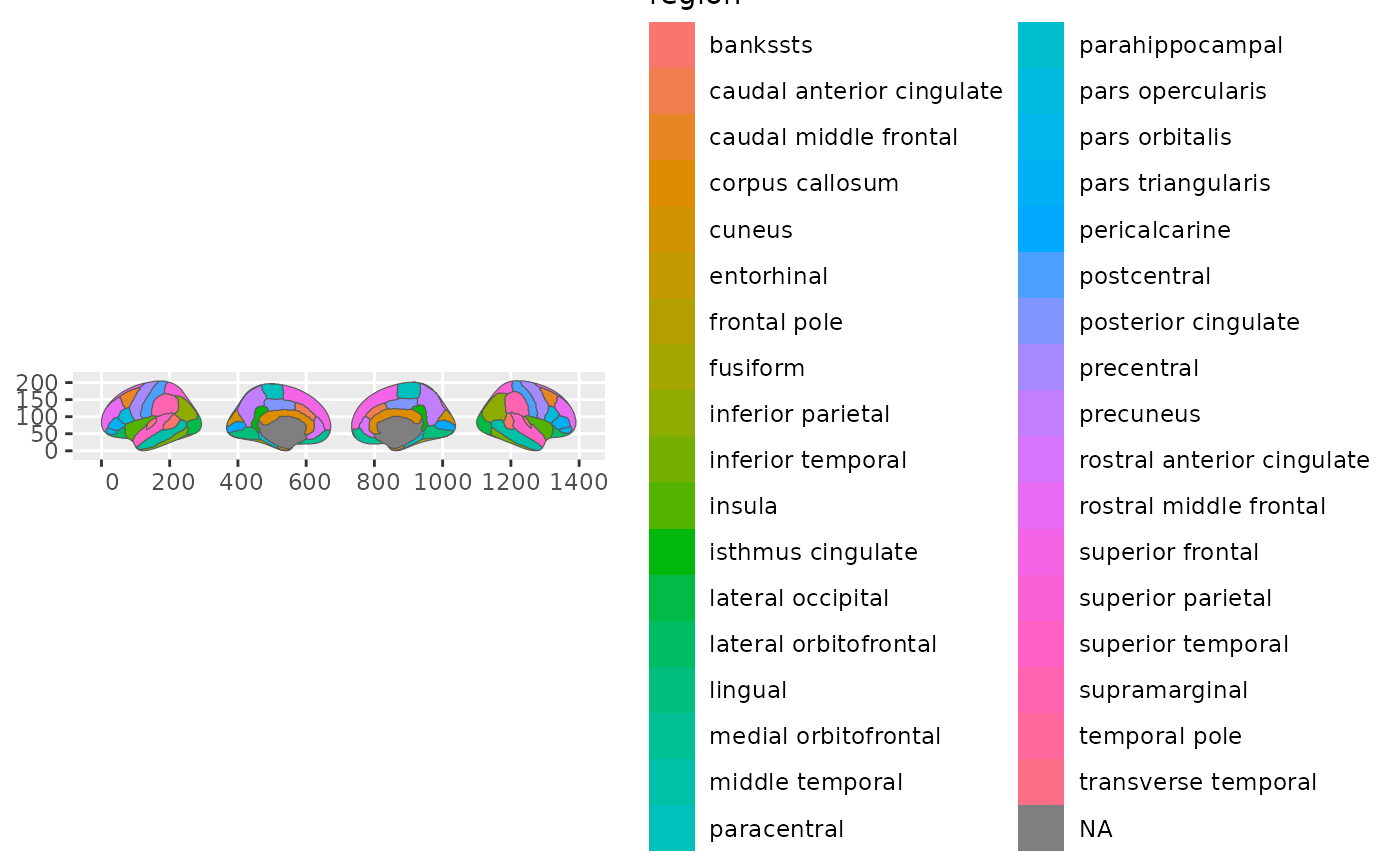
Colour brain regions by your own values. Give geom_brain() an atlas like
dk() and a data frame, and it matches your values to the right regions and
lays out the brain views for you. No data? It just draws the atlas.
Usage
geom_brain(
  mapping = aes(),
  data = NULL,
  atlas,
  hemi = NULL,
  view = NULL,
  position = position_brain(),
  context = TRUE,
  fun = mean,
  show.legend = NA,
  inherit.aes = TRUE,
  ...
)
Arguments
- mapping
Set of aesthetic mappings created by
ggplot2::aes().- data
A data.frame containing variables to map. If
NULL, the atlas is plotted without user data. Add a facet withggplot2::facet_wrap()to draw one brain per group.- atlas
- hemi
Character vector of hemispheres to include (e.g.
"left","right"). Defaults to all hemispheres in the atlas.- view
Character vector of views to include, as recorded in the atlas data. For cortical atlases:
"lateral","medial". For subcortical/tract atlases: slice identifiers like"axial_3". Defaults to all views.- position
Position adjustment, either as a string or the result of a call to
position_brain().- context
Keep the rest of the brain as a soft grey backdrop (
TRUE, the default), or show only the regions you're plotting (FALSE).- fun
Function used to combine multiple
datarows that map to the same atlas region, applied within each facet panel. Defaults tomean(). Any function reducing a vector to a single value works (e.g.median(),max()).- show.legend
Logical. Should this layer be included in the legends?
- inherit.aes
Logical. If
FALSE, overrides the default aesthetics rather than combining with them.- ...
Additional arguments passed to
ggplot2::geom_polygon().
Details
Regions are drawn in the order they appear in your data, so when outlines
overlap (e.g. mapping colour to a threshold with a wide linewidth) the
later rows draw on top. Reorder your data with dplyr::arrange() to control
the layering; regions you supply no value for stay underneath in atlas order.
Faceting works without any dplyr::group_by(): the atlas geometry is drawn
by StatBrain, which ggplot2 recomputes per panel, so the complete brain
appears in every facet. If your data has several rows for the same region
(e.g. one per subject), they are combined with fun (mean by default) before
drawing.
GeomBrain ggproto
GeomBrain is the ggplot2::Geom ggproto that renders brain atlas polygons.
It subclasses ggplot2::GeomPolygon and supplies the brain defaults through
default_aes – outline colour (grey35), linewidth (0.2), and fill
(grey) – which apply when the user has not mapped those aesthetics but yield
to a mapping when present (ggsegverse/ggseg#160). The grey default fill is
why an atlas plotted without data renders grey, not palette-coloured. Used
internally by geom_brain(); not typically called directly.
StatBrain ggproto
StatBrain is the ggplot2::Stat that powers geom_brain() and
stat_brain(). Its compute_panel() receives one facet panel's user data,
aggregates the mapped values per atlas region with fun, and joins them onto
the full atlas geometry – so every region renders in every panel whether or
not you supplied a value for it. You rarely reference it directly; use it via
geom_brain(..., stat = StatBrain) or stat_brain() when building a custom
layer.
See also
stat_brain() for the stat-first spelling.