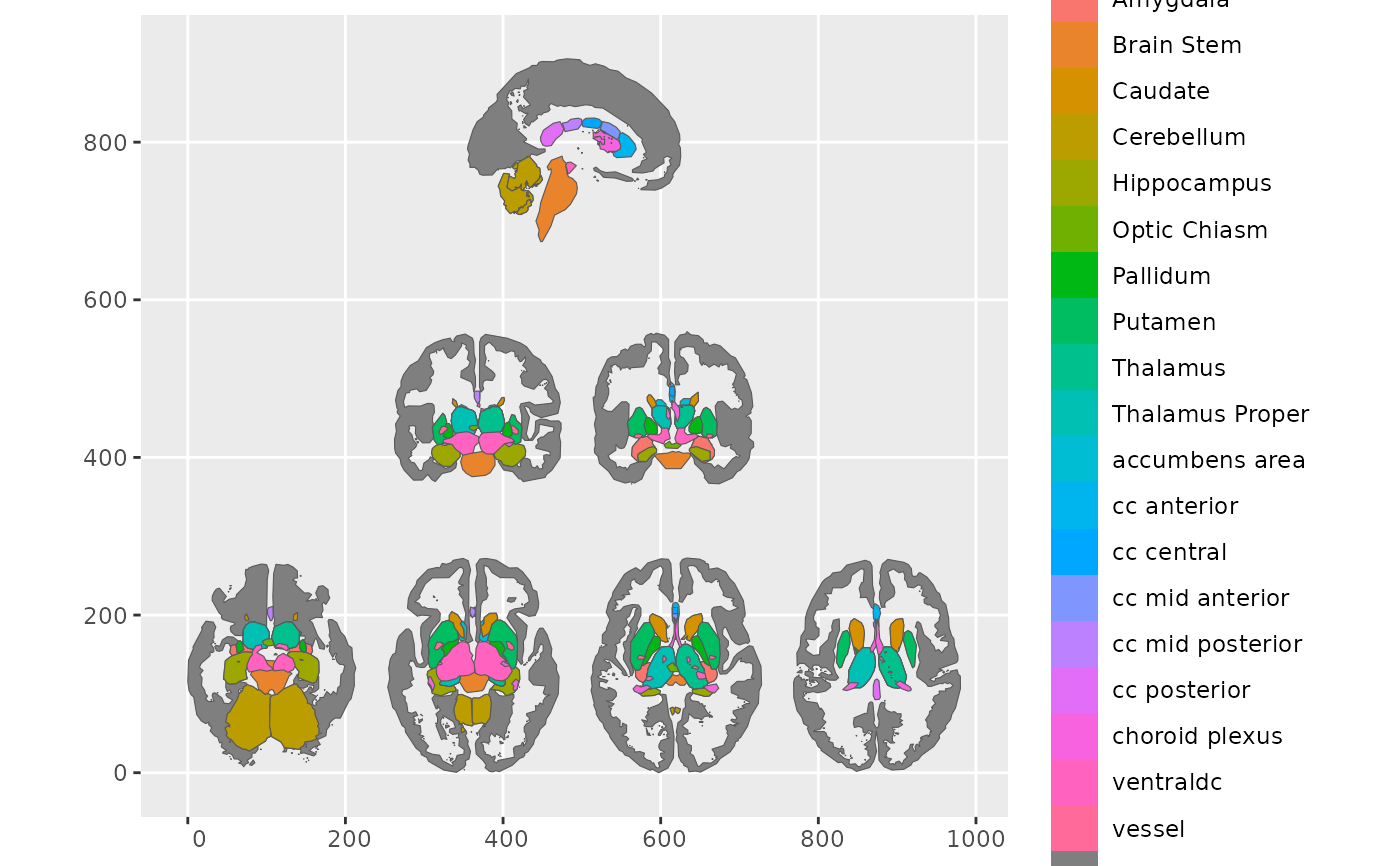
Controls how an atlas's hemispheres and views are arranged in the plot –
side by side, stacked, or in a grid – and can zoom each view in on the
regions you care about. Pass the result to the position argument of
geom_brain() (or annotate_brain()).
Usage
position_brain(
  position = "horizontal",
  nrow = NULL,
  ncol = NULL,
  views = NULL,
  zoom = NULL,
  zoom_pad = 0.05
)
Arguments
- position
Formula describing the rows ~ columns organisation for cortical atlases (e.g.,
hemi ~ view). For subcortical/tract atlases, can be "horizontal", "vertical", or a formula withtype ~ .where type is extracted from view names like "axial_1" -> "axial".- nrow
Number of rows for grid layout. If NULL (default), calculated automatically. Only used for subcortical/tract atlases when position is not a formula.
- ncol
Number of columns for grid layout. If NULL (default), calculated automatically. Only used for subcortical/tract atlases when position is not a formula.
- views
Character vector specifying which views to include and their order. If NULL (default), all views are included in their original order. Only applies to subcortical/tract atlases.
- zoom
Controls per-view zoom.
NULL/FALSE(default) draws each view at full extent.TRUEzooms each view onto its focus regions; a character vector names the focus regions explicitly.- zoom_pad
Fractional padding added around the focus window when
zoomis active. Defaults to0.05(5%).
Value
A layout specification to hand to geom_brain()'s position
argument.
Examples
library(ggplot2)
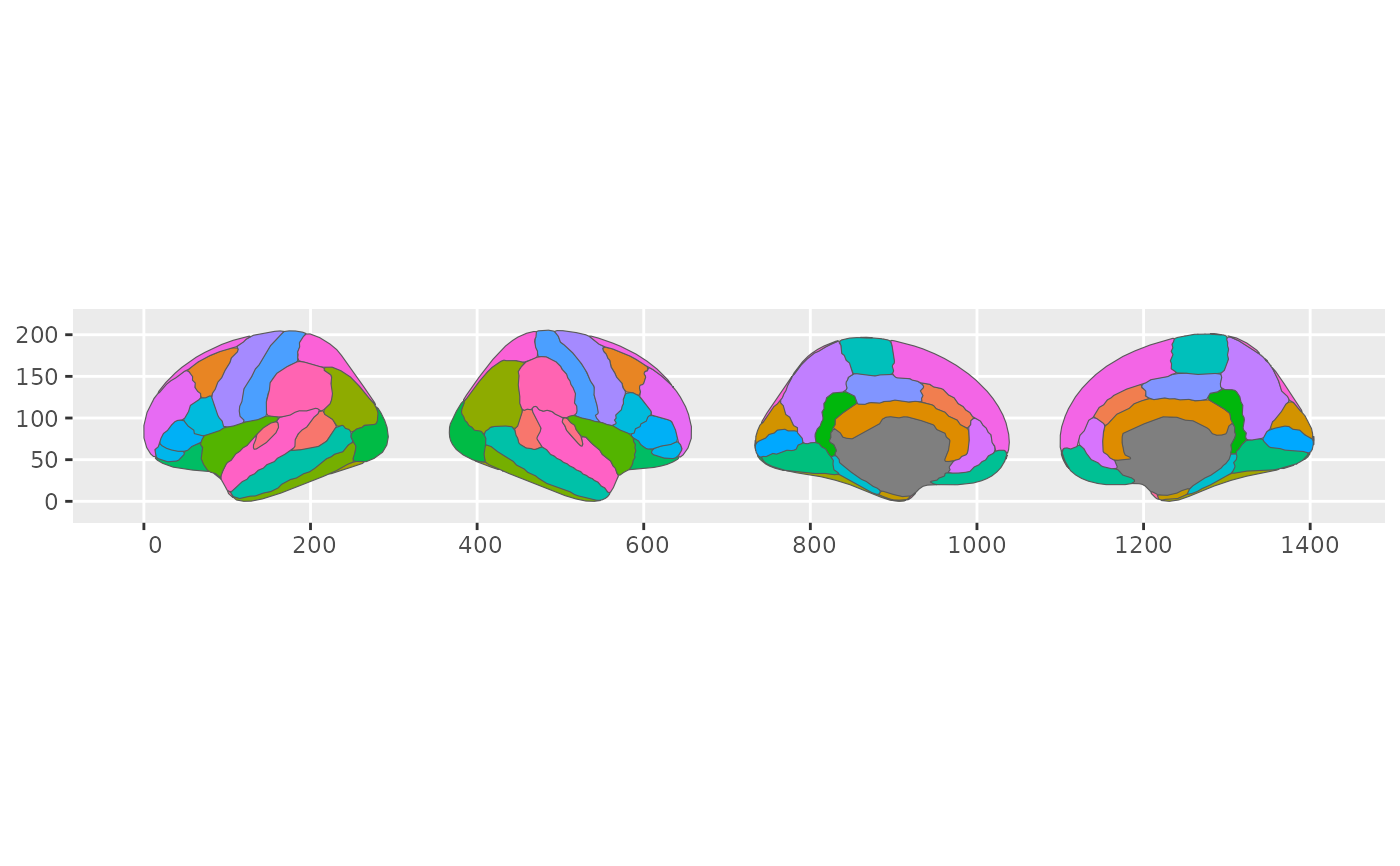
# Cortical atlas with formula
ggplot() +
geom_brain(
atlas = dk(), aes(fill = region),
position = position_brain(. ~ view + hemi),
show.legend = FALSE
)
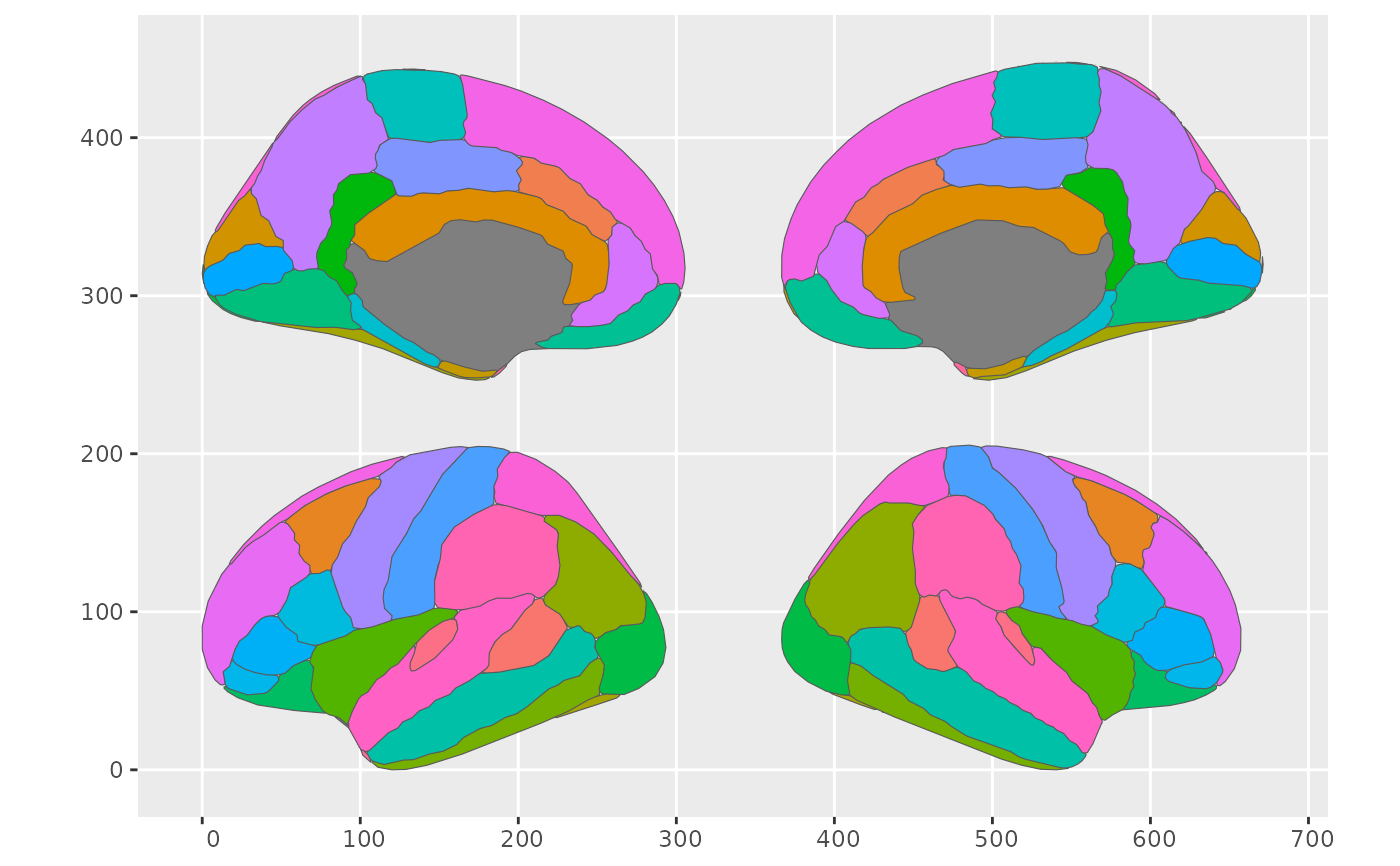
 ggplot() +
geom_brain(
atlas = dk(), aes(fill = region),
position = position_brain(view ~ hemi),
show.legend = FALSE
)
ggplot() +
geom_brain(
atlas = dk(), aes(fill = region),
position = position_brain(view ~ hemi),
show.legend = FALSE
)
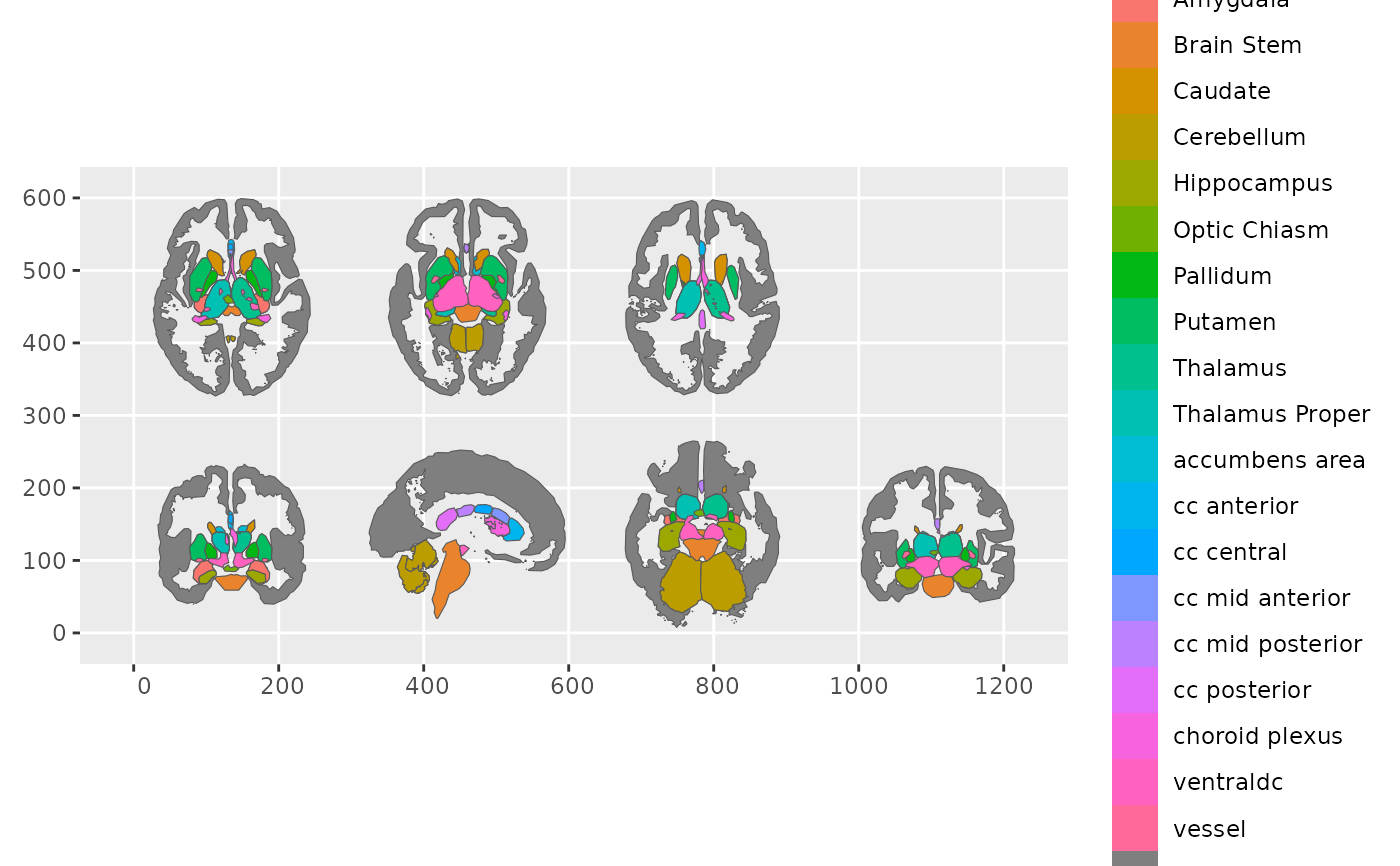
 ggplot() +
geom_brain(
atlas = aseg(), aes(fill = region),
position = position_brain(nrow = 2)
)
ggplot() +
geom_brain(
atlas = aseg(), aes(fill = region),
position = position_brain(nrow = 2)
)
 ggplot() +
geom_brain(
atlas = aseg(), aes(fill = region),
position = position_brain(
views = c("sagittal", "axial_3", "coronal_2"),
nrow = 1
)
)
ggplot() +
geom_brain(
atlas = aseg(), aes(fill = region),
position = position_brain(
views = c("sagittal", "axial_3", "coronal_2"),
nrow = 1
)
)
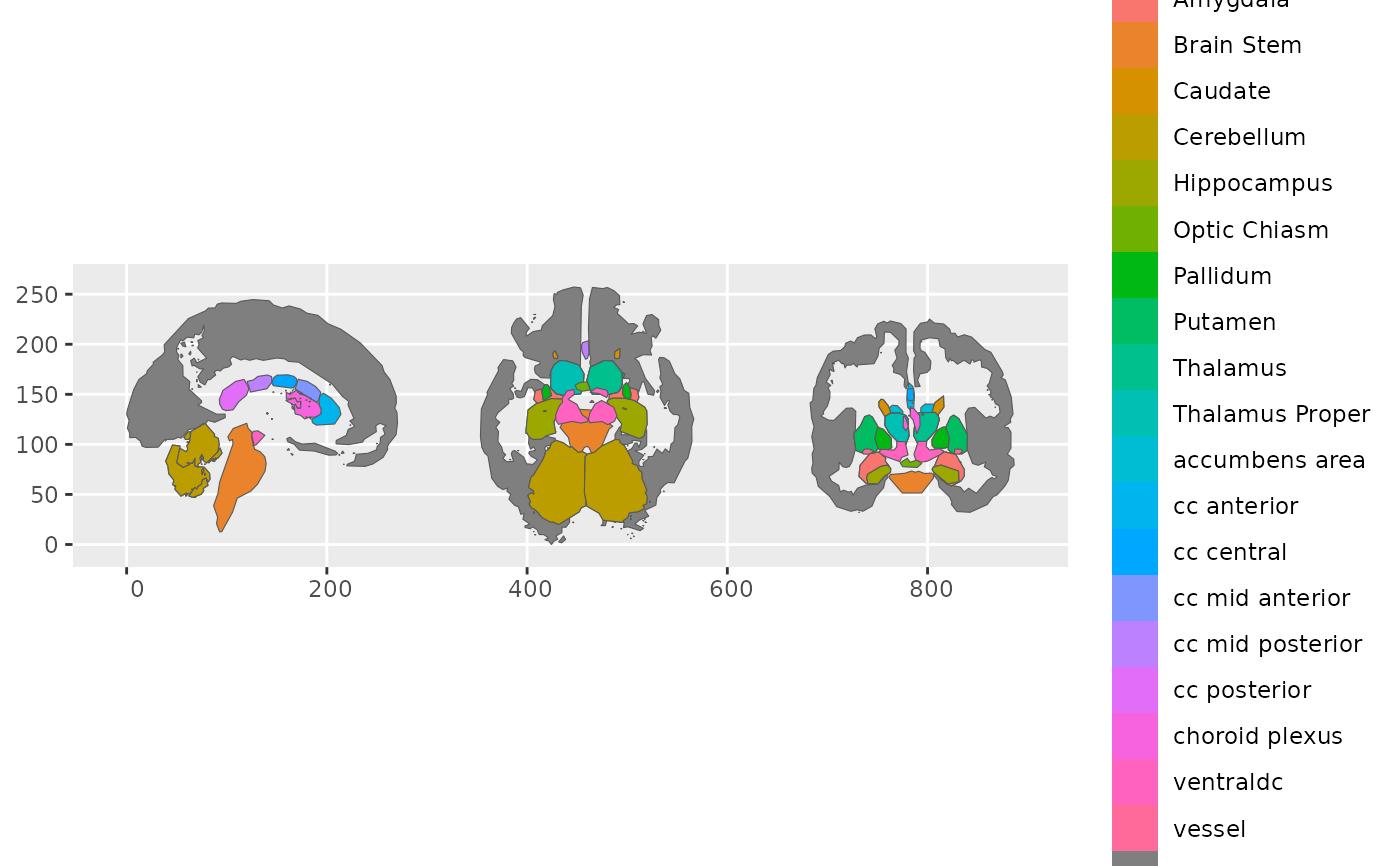 ggplot() +
geom_brain(
atlas = aseg(), aes(fill = region),
position = position_brain(type ~ .)
)
ggplot() +
geom_brain(
atlas = aseg(), aes(fill = region),
position = position_brain(type ~ .)
)